
Figure A1.
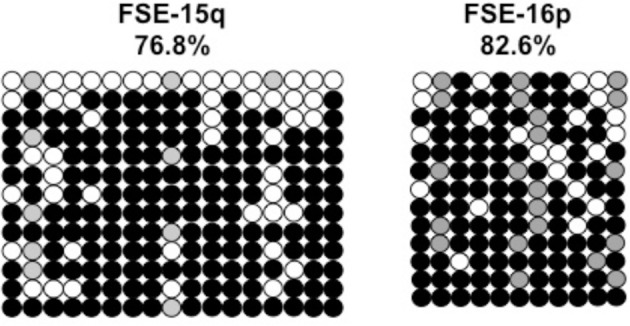
Bisulfite analysis of subtelomeric regions 15q and 16p in WT FSE fibroblast. Bisulfite sequence analysis was carried out for a region in subtelomeres 15q and 16p. The analyzed regions contain 17 CpG sites in 15q subtelomere and 11 CpG sites in subtelomere 16p. White circles represent unmethylated CpG dinucleotides and black circles represent methylated CpG dinucleotides. Gray circles represent CpG sites that were converted to CpA or TpA, as occasionally can be observed. Each row is derived from an individual subclone. Percent of CpG methylation appears below the cell type.