
Fig. 2. The effect of SLN-PS on cytokinetics and mediators of apoptosis in A549 lung cancer cells.
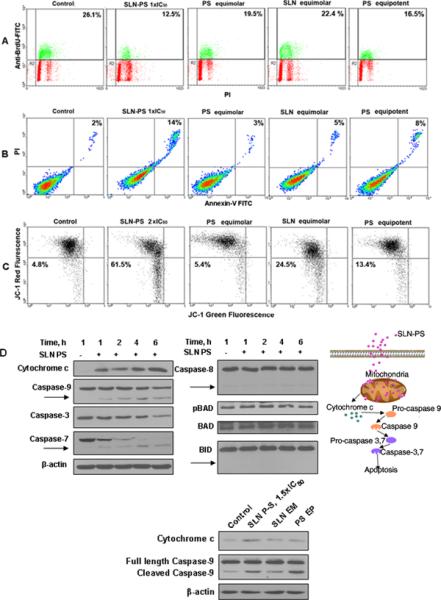
Cells were treated with SLN-PS or PS (equimolar or equipotent to SLN-PS in terms of cell growth inhibition) or plain SLNs (no drug loaded) equivalent to SLN-PS. A: Cell proliferation was determined by BrdU incorporation after 6 h treatment with the test compounds. Numbers indicate the percentage of cells in S phase. B: Apoptosis was determined by flow cytometry in cells stained with Annexin-V (abscissa) and PI (ordinate). Apoptotic cells are in the right upper quadrant; their proportion of the total is indicated as a percentage. C: Mitochondrial transmembrane potential (Δψm) was determined using the molecular marker JC-1; increased JC-1 green fluorescence indicates decreased Δψm. D: Immunoblots of various proteins involved in the apoptosis cascade. A549 cells were treated with SLN-PS for the indicated time periods and SLN-PS, SLNs or PS for 4 h. Arrows: products of hydrolytic cleavage of the corresponding (pro)caspase. These findings establish the activation of the intrinsic apoptosis pathway, shown diagrammatically on the right.