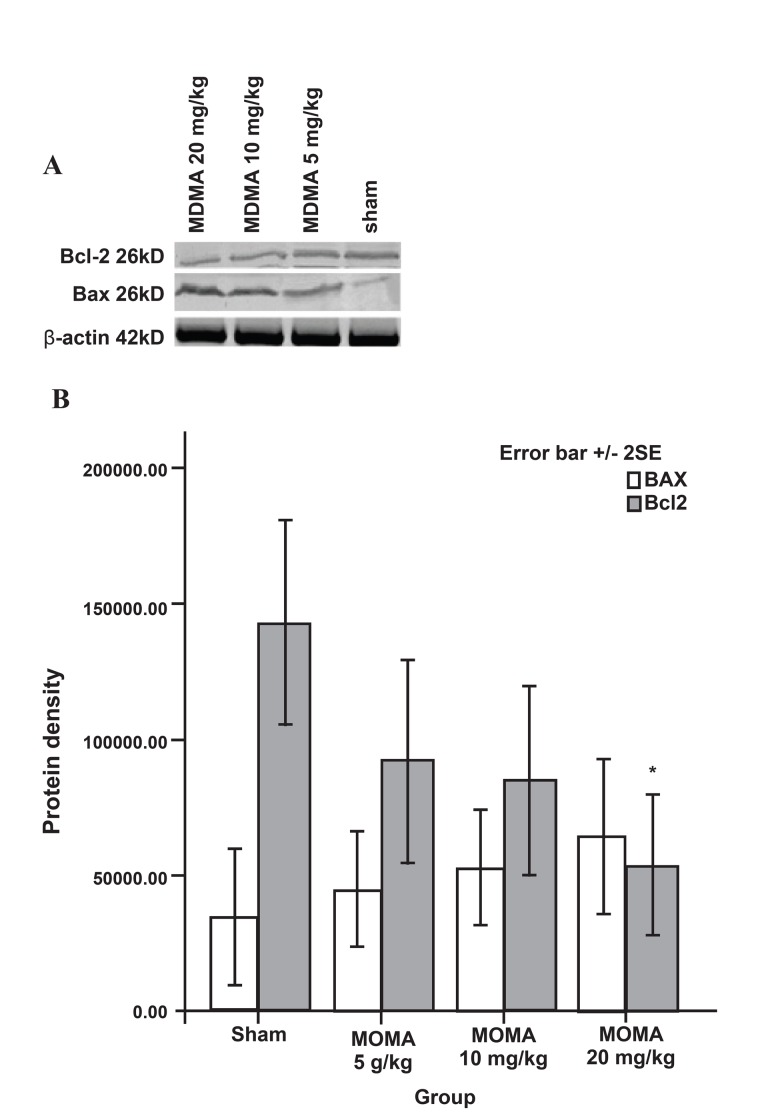
Fig 1.
Western blot analysis of Bax and Bcl-2 protein expressions in sham and MDMA groups (n=5 per group) that received MDMA (0, 5, 10, 20 mg/kg i.p. twice daily) for 7 days. The frozen hippocampi were lysed, transferred to nitrocellulose paper, incubated with anti-Bcl-2, anti-Bax antibodies, and secondary anti-mouse antibody. Bands were then detected by chromogenic substrate. Data were analyzed using one-way analysis of variance (ANOVA) followed by Tukey test for multiple comparisons. *p<0.001 vs. sham group.

