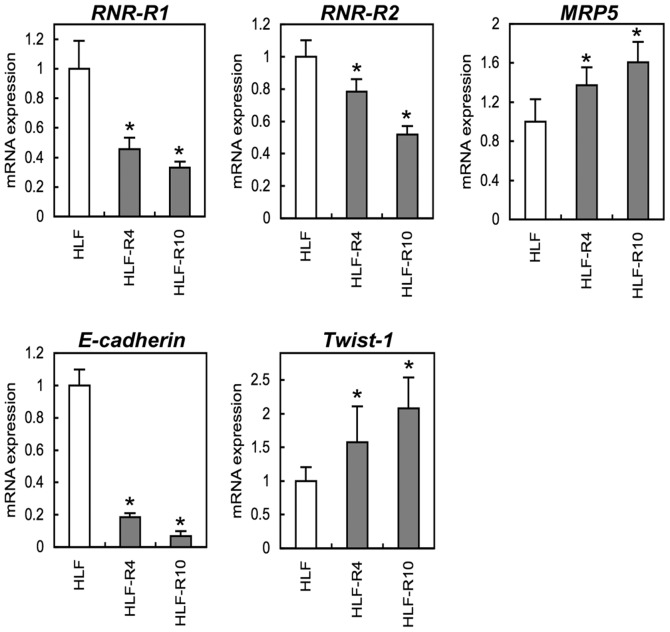
Figure 5.
mRNA expression analysis. qRT-PCR was performed to investigate mRNA levels of RNR-R1, RNR-R2, MRP5, E-cadherin, and Twist-1. PCR shows up-regulation of MRP5 and Twist-1 and down-regulation of RNR-R1, RNR-R2, and E-cadherin dependent on the level of 5-FU chemoresistance. Data are expressed as the means ± standard error of the mean values from three assays (*p<0.05 by the Mann-Whitney U test).

