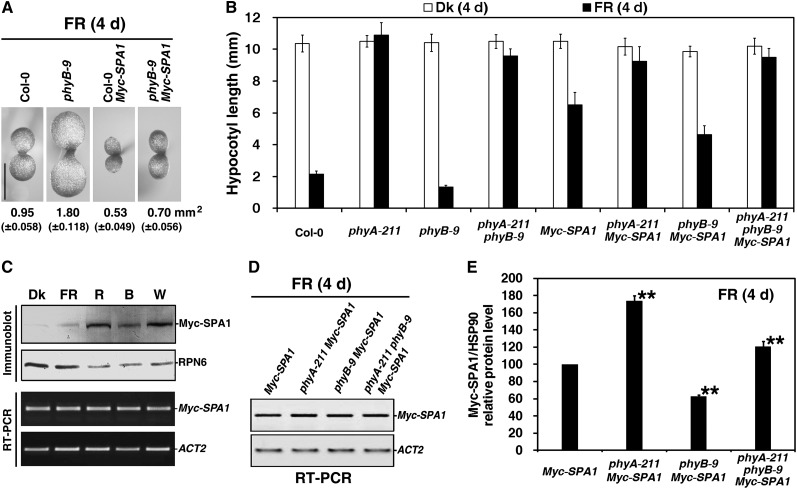
Figure 5.
PhyB Enhances SPA1 Accumulation under FR Light.
Seedlings were grown in the dark (Dk) or under FRc light for 4 d. The fluence rate of the FR light was 18.1 µmol·m–2·s–1, unless otherwise indicated.
(A) The phyB-9 mutant rescued the small cotyledon size caused by overexpression of Myc-SPA1 (parental line, in Col-0 background; Yang and Wang, 2006). Seedlings were grown under FRc (2.5 µmol·m–2·s–1) for 4 d. Numbers indicate the cotyledon area and numbers in parentheses represent sd. Bar = 1 mm.
(B) Histograms comparing hypocotyl lengths of the wild type (Col-0), phyA-211, phyB-9, phyA-211 phyB-9, Myc-SPA1, phyA-211 Myc-SPA1, phyB-9 Myc-SPA1, and phyA-211 phyB-9 Myc-SPA1 (average of 60) seedlings in the dark or under FR light. Error bars indicate the sd.
(C) Immunoblot and RT-PCR analyses showing that the Myc-SPA1 transgenic line accumulated different protein levels, with comparable transcript abundance, in the dark or under FRc (2.5 µmol·m–2·s–1), R light (30.0 µmol·m–2·s–1), B light (5.0 µmol·m–2·s–1), and W light (100.0 µmol·m–2·s–1). For immunoblot analysis, an anti-RPN6 (a 26S proteasome subunit) immunoblot is shown at the bottom to indicate approximately equal protein loading. For RT-PCR analysis, amplification of the ACT2 gene is shown below as a positive control.
(D) RT-PCR analysis of Myc-SPA1 transcript levels in seedlings of Myc-SPA1, phyA-211 Myc-SPA1, phyB-9 Myc-SPA1, and phyA-211 phyB-9 Myc-SPA1 grown under FR light for 4 d. RT-PCR of the ACT2 gene is shown at the bottom as a positive control.
(E) Quantification of relative Myc-SPA1/HSP90 protein levels from Myc-SPA1, phyA-211 Myc-SPA1, phyB-9 Myc-SPA1, and phyA-211 phyB-9 Myc-SPA1 corresponding to Supplemental Figure 4 online, showing that phyB enhanced Myc-SPA1 protein accumulation in the presence and absence of phyA under FR light. Error bars represent sd from triplicate experiments. Asterisks mark significant differences in relative Myc-SPA1/HSP90 protein levels from that in Myc-SPA1 according to Student’s t test (*P < 0.05; **P < 0.01).

