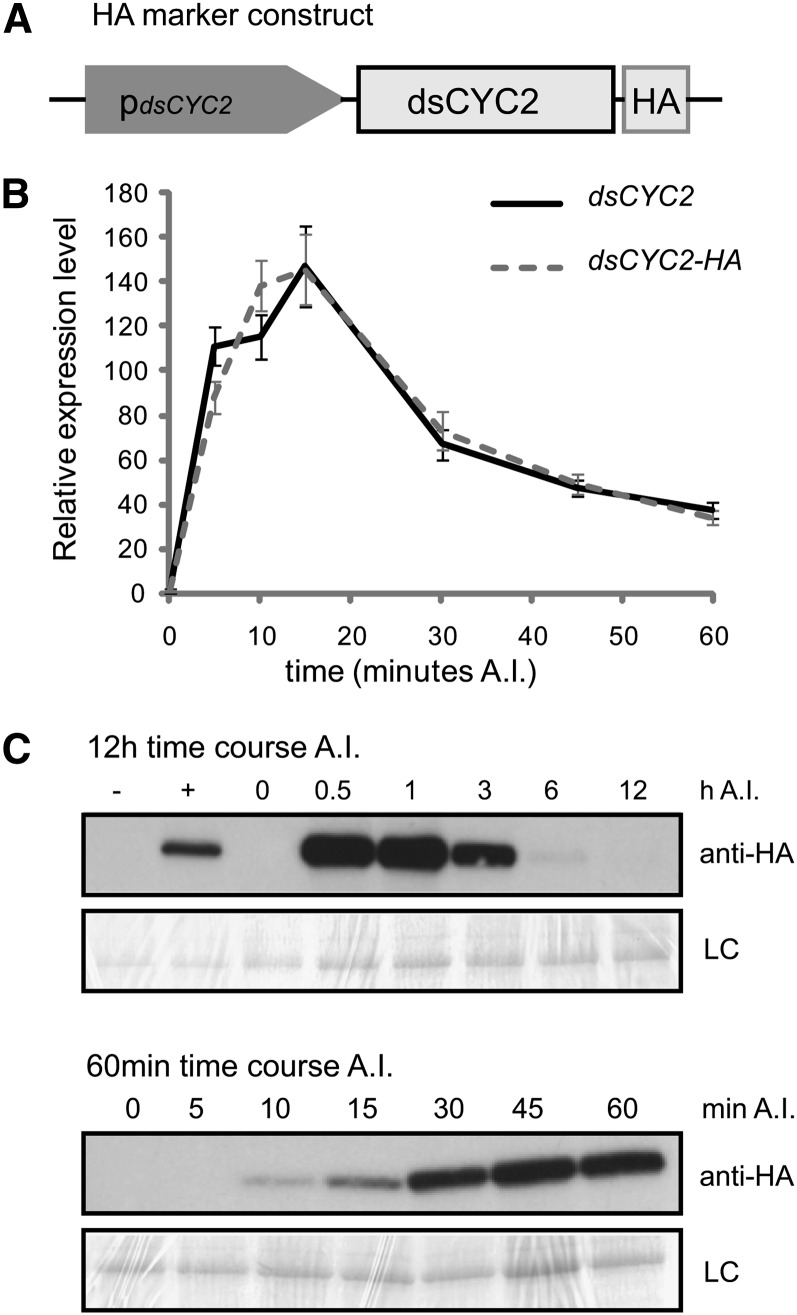
Figure 1.
Light-Dependent Transcription and Translation of dsCYC2.
(A) Schematic representation of the HA marker construct.
(B) Transcript levels of dsCYC2 (solid line) and HA-tagged dsCYC2 (dashed line) during a 60-min time course after illumination (A.I.) of 24-h dark-adapted HA marker cells. Values were normalized against those obtained for histone H4 and then rescaled to the gene expression levels at 0 min after illumination (=1). Error bars represent se of three technical replicates.
(C) dsCYC2-HA protein levels during a 12-h (top panel) and 60-min (bottom panel) time course after illumination of 24-h dark-adapted HA marker cells. −, Negative control (wild-type 4 h light); +, positive control (HA 4 h light). LC, loading control by Coomassie blue staining.

