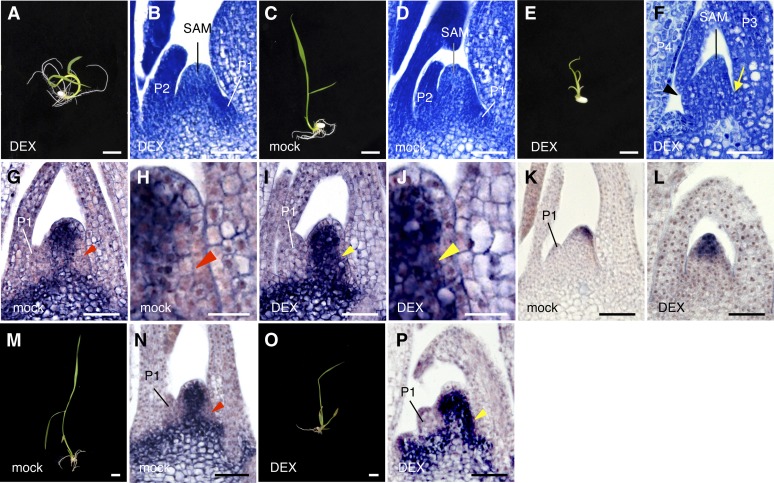
Figure 2.
Effects of Inducible Silencing of FCP1 and Cosilencing of FCP1-FCP2.
(A) and (B) Transgenic shoot with pACT1-GVG>FCP1:RNAi (25 µM DEX).
(C) and (D) Transgenic shoot with pACT1-GVG>FCP1-FCP2:RNAi (mock).
(E) and (F) Transgenic shoot with pACT1-GVG>FCP1-FCP2:RNAi (25 µM DEX). Arrow and arrowhead indicate the positions for the formation of P1 and P2 primordia, respectively. Note that no leaf primordium is observed in these positions.
(G) and (H) Spatial expression pattern of OSH1 in the shoot apex of a transgenic shoot with pACT1-GVG>FCP1-FCP2:RNAi (mock). (H) is a magnified view of part of (G). OSH1 is downregulated in the P0 site (red arrowheads).
(I) and (J) Spatial expression pattern of OSH1 in the shoot apex of a transgenic shoot with pACT1-GVG>FCP1-FCP2:RNAi (50 µM DEX). (J) is a magnified view of part of (I). Note that OSH1 is expressed in the P0 site (yellow arrowheads).
(K) Spatial expression pattern of FON2 in the shoot apex of a transgenic shoot with pACT1-GVG>FCP1-FCP2:RNAi (mock).
(L) Spatial expression pattern of FON2 in the shoot apex of a transgenic shoot with pACT1-GVG>FCP1-FCP2:RNAi (50 µM DEX).
(M) and (N) Shoot (M) and spatial expression pattern of OSH1 (N) in a transgenic shoot with pACT1-GVG>FCP1-FCP2:RNAi (mock). OSH1 is downregulated in the P0 site (red arrowhead in [N]).
(O) and (P) Shoot (O) and spatial expression pattern of OSH1 (P) in a transgenic shoot with pACT1-GVG>FCP1-FCP2:RNAi (25 µM DEX). Yellow arrowhead in (P) indicates the P0 site, where OSH1 is ectopically expressed.
Seedlings were grown for 7 d from germination in the presence or absence of DEX ([A] to [L]) or for 5 d from germination in MS medium and treated without or with DEX for 5 d ([M] to [P]). Bars = 1 cm in (A), (C), (E), (M), and (O), 50 µm in (B), (D), (F), (G), (I), (K), (L), (N), and (P), and 20 µm in (H) and (J).

