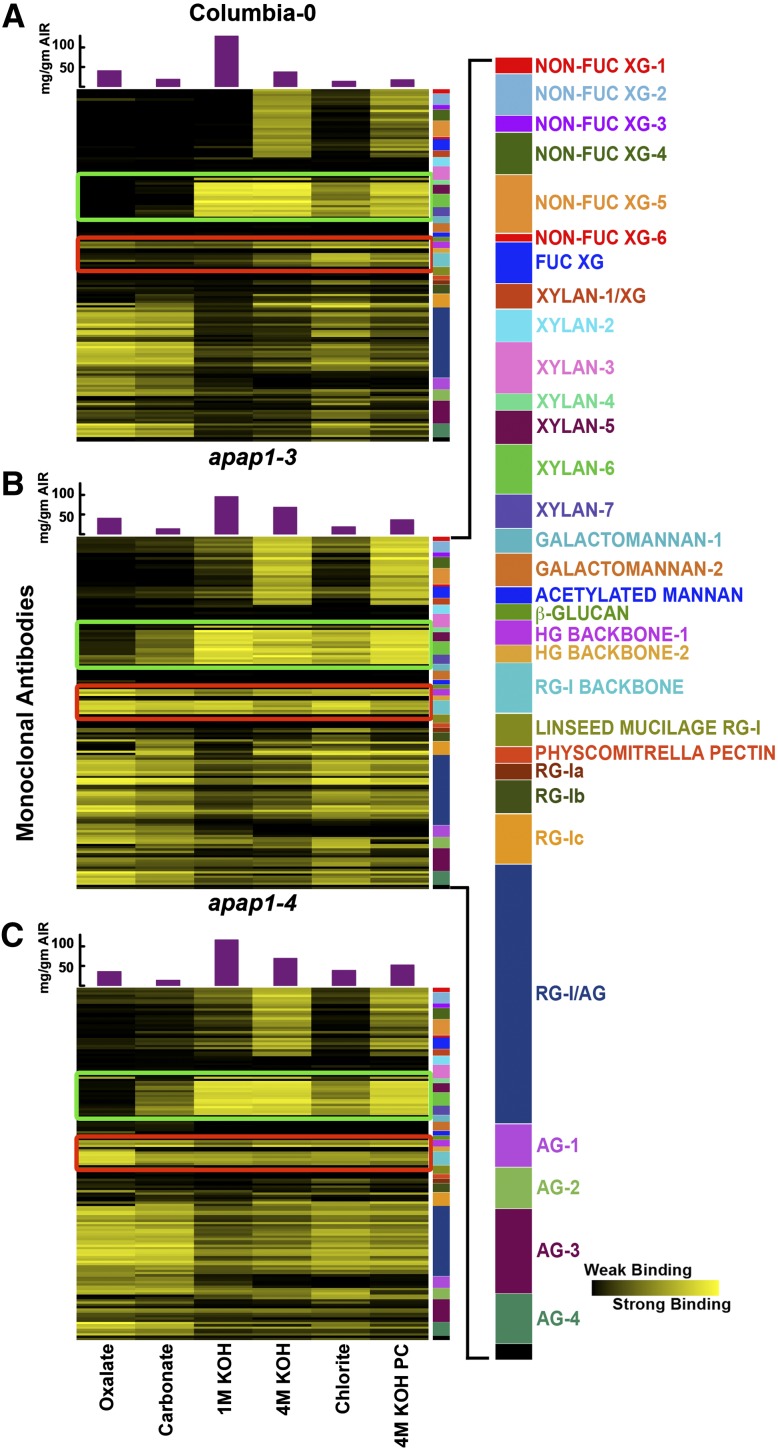
Figure 5.
Glycome Profiling of Sequential Cell Wall Extracts from 8-Week-Old Arabidopsis apap1-3 and apap1-4 Mutant and Wild-Type Plants.
(A) Glycome profiling of the wild type. Panels show analyses of representative examples from multiple biological replicates (see Supplemental Figure 7 online for full set of results). Sequential cell wall extracts were prepared from the aerial portion (above the rosette leaves) of 8-week-old Arabidopsis wild-type (Columbia-0) (A), apap1-3 mutant (B), and apap1-4 mutant (C) plants. Labels at the bottom show reagents used for the different extraction steps. The amounts of material extracted in each extraction step are indicated in the bar graphs above the heat maps. Extracts were ELISA screened using 155 plant cell wall glycan-directed monoclonal antibodies (see Supplemental Table 4 online; Pattathil et al., 2010). Data are represented as heat maps. The panel on the right of the heat maps shows the antibodies used, color-coded as groups based on the principal cell wall glycans recognized by each antibody group (see Supplemental Table 4 online; Pattathil et al., 2010). Major changes in binding of specific antibodies to different mutant versus wild-type wall extracts are outlined in green (xylan groups 3 to 7) and red (HG backbone-1 and RG-1 backbone). The strength of the ELISA signal is indicated by a yellow-black scale, with bright yellow depicting strongest binding and black indicating no binding.
(B) Glycome profiling of the apap1-3 mutant as described in (A).
(C) Glycome profiling of the apap1-4 mutant as described in (A).

