Figure 2.
A Prolonged Quiescent Phase Is Induced during Salt Stress in Postemergent LRs.
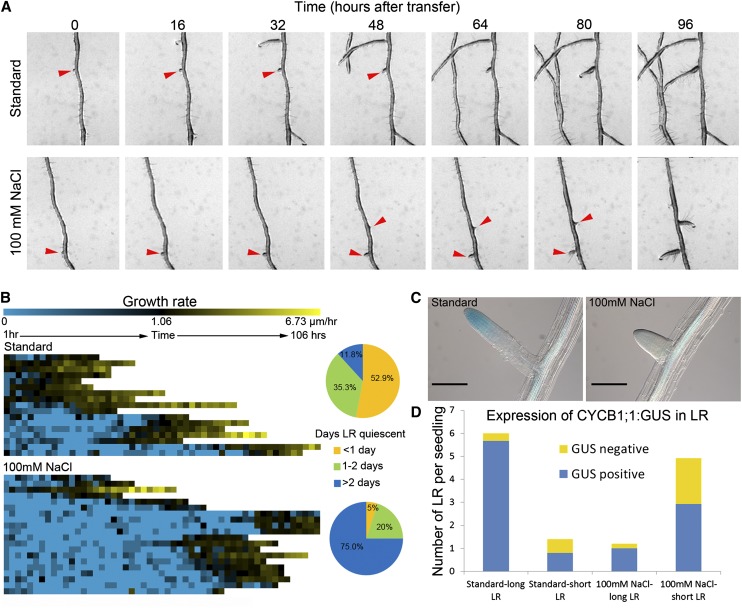
(A) Time-lapse images of 6 dpg Col-0 seedlings after transfer to standard conditions (top panels) or 100 mM NaCl conditions (bottom panels). Red arrowheads mark quiescent LRs.
(B) Heat map showing the growth profiles of individual LRs quantified from time-lapse imaging data. Each pixel in the heat map represents the total growth over 2 h. Data quantified from 10 to 12 seedlings transferred to standard (n = 17 LRs) or salt stress (n = 20 LRs) conditions and imaged for 7 dpt. Pie charts to the right of the heat maps quantify the proportion of LRs that are quiescent for different lengths of time. Salt stress causes a dramatic increase in the number of roots showing quiescent growth for more than 2 d.
(C) Staining pattern of the CYCB1;1:GUS reporter in postemergent LRs 3 dpt to standard conditions (left panel) or to 100 mM NaCl conditions (right panel). Bars = 100 μm.
(D) Quantification of CYCB1;1:GUS activity at different stages of postemergent LR development under standard or salt stress conditions (n = 15 individual seedlings). LRs were categorized as long or short based on the presence of a clear elongation and maturation zone. More LRs are shorter under salt stress conditions and these roots often lack GUS reporter expression.

