Figure 6.
Suppression of Endodermal ABA Signaling Leads to a Loss of Salt-Induced Quiescence and Unsustainable Growth Recovery.
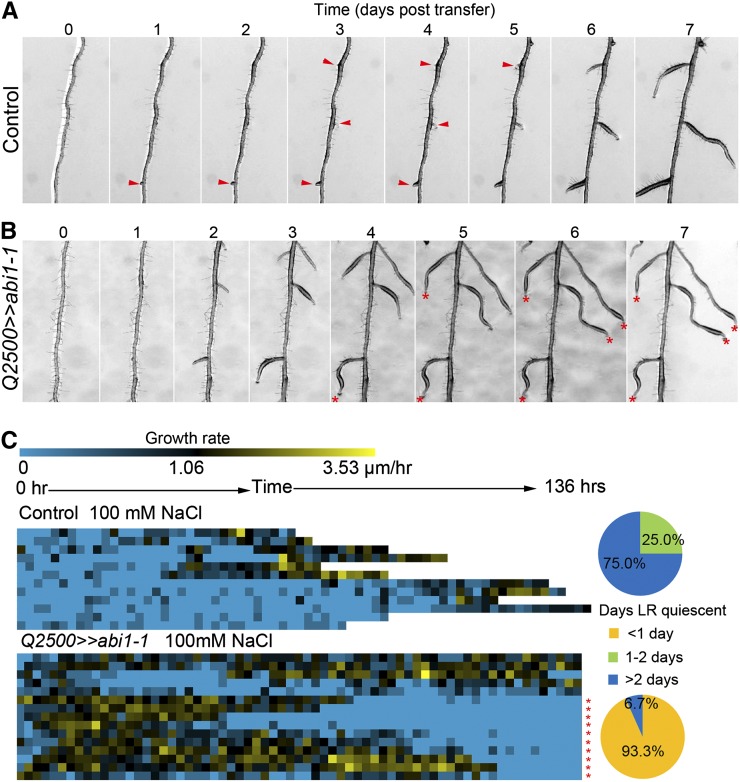
(A) and (B) Time-lapse images of enhancer trap control (A) or Q2500>>abi1-1 transactivation seedlings (B) after transfer to 100 mM NaCl conditions. Red arrowheads mark quiescent LRs. Red asterisks mark LRs that showed unsustainable growth recovery.
(C) Heat map showing the growth profiles of individual LRs quantified from time-lapse imaging data. Each pixel in the heat map represents the total growth over 2 h. Data quantified from enhancer trap control seedlings (n = 12 LRs) or Q2500>>abi1-1 transactivation seedlings (n = 15 LRs) transferred to 100 mM NaCl conditions and imaged for 7 d. Pie charts to the right of the heat maps quantify the proportion of LRs that are quiescent for different lengths of time. Red asterisks mark LRs that show unsustainable growth recovery, 10 out of 15.

