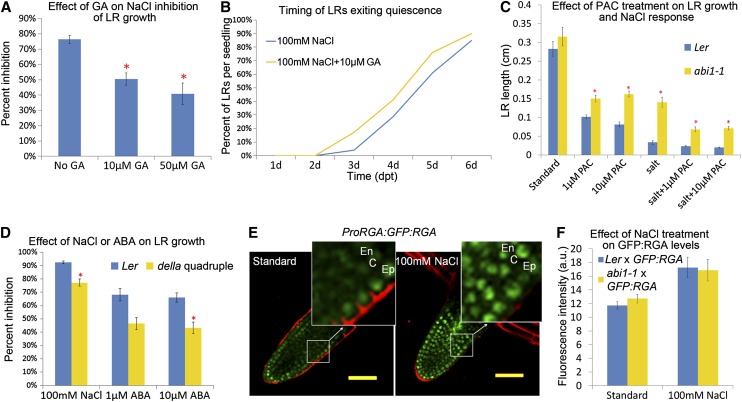
Figure 7.
Integration of GA and ABA Signaling Pathways during Salt Stress.
(A) Percentage of difference in average LR length per seedling quantified 4 dpt to media containing 100 mM NaCl compared with control conditions. Media was supplemented with 0, 10, or 50 μM GA (n > 20 seedlings). Ecotype used here is Col-0.
(B) Percentage of LRs (ProRAB18:GFP) that had exited quiescence after transfer to 100 mM NaCl with or without 10 μM GA. Emerged LRs were followed on six to 10 individual seedlings over 6 d. LRs that were shorter than 0.5 mm in length were categorized as quiescent.
(C) Average length of LRs per seedling for Ler and abi1-1 mutants measured 4 dpt to standard or 100 mM NaCl media supplemented with various concentrations of the GA biosynthesis inhibitor, PAC (n > 17 seedlings).
(D) Percentage of difference in the average LR length per seedling 4 dpt to media supplemented with 100 mM NaCl or two different concentrations of ABA. Genotype is Ler or the della quadruple mutant (n > 20 individual seedlings).
(E) Confocal images of postemergence stage LRs grown under standard (left panel) or 100 mM NaCl (right panel) conditions and expressing the ProRGA:GFP-RGA reporter. Bars = 50 μm. En, endodermis; C, cortex; Ep, epidermis.
(F)Quantification of GFP fluorescence intensity in F1 hybrid plants generated by a cross between Ler and ProRGA:GFP:RGA or abi1-1 −/− and ProRGA:GFP:RGA. Seedlings grown for 3 dpt to standard or 100 mM NaCl conditions (n > 8 LRs). a.u., arbitrary units.
Error bars indicate se. Red asterisks represent significant differences as determined by the Student’s t test, P value < 0.05.

