Figure 6.
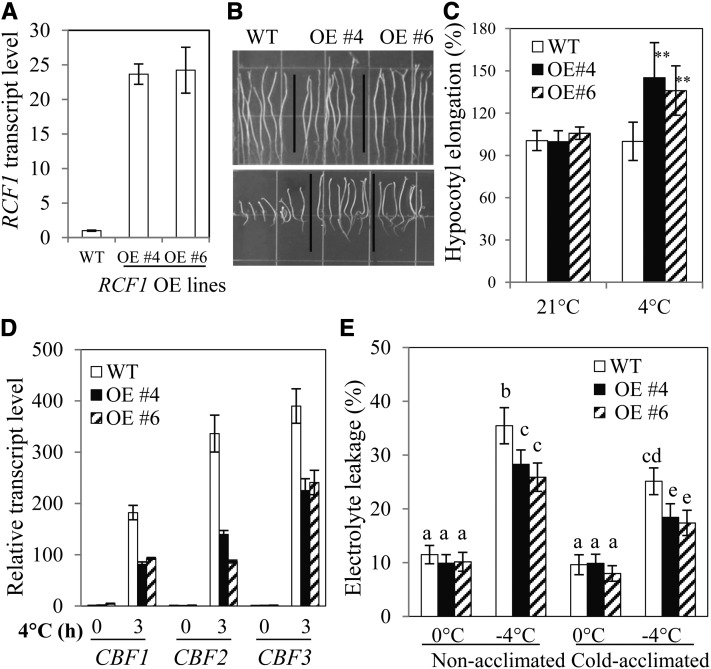
Overexpression of RCF1 Increases Cold Stress Tolerance.
(A) RCF1 expression levels in the wild type (WT) and two transgenic lines overexpressing RCF1 (OE).
(B) Chilling stress tolerance of wild-type and RCF1 OE plants. Top panel, 21°C for 13 d; bottom panel, 4°C in the dark for 32 d.
(C) Quantification of hypocotyl elongation of plants shown in (B). Hypocotyl elongation of the wild type (at 21°C or 4°C) was considered to be 100%. **P < 0.01, as determined by Student’s t test.
(D) Expression of CBF1, CBF2, and CBF3 in wild-type and RCF1 OE plants subjected to 0 or 3 h at 4°C.
(E) Freezing tolerance of RCF1 OE plants determined by electrolyte leakage assays.
Cold acclimated (4°C for 1 week). Error bars indicate the sd (n = 4 in [A] and [D]; n = 20 in [C]; n = 12 in [E]). One-way ANOVA (Tukey-Kramer test) was performed for data in (E), and statistically significant differences are indicated by different lowercase letters (P < 0.005). Experiments in were repeated at least three times with similar results, and values shown are from one experimental repetition.

