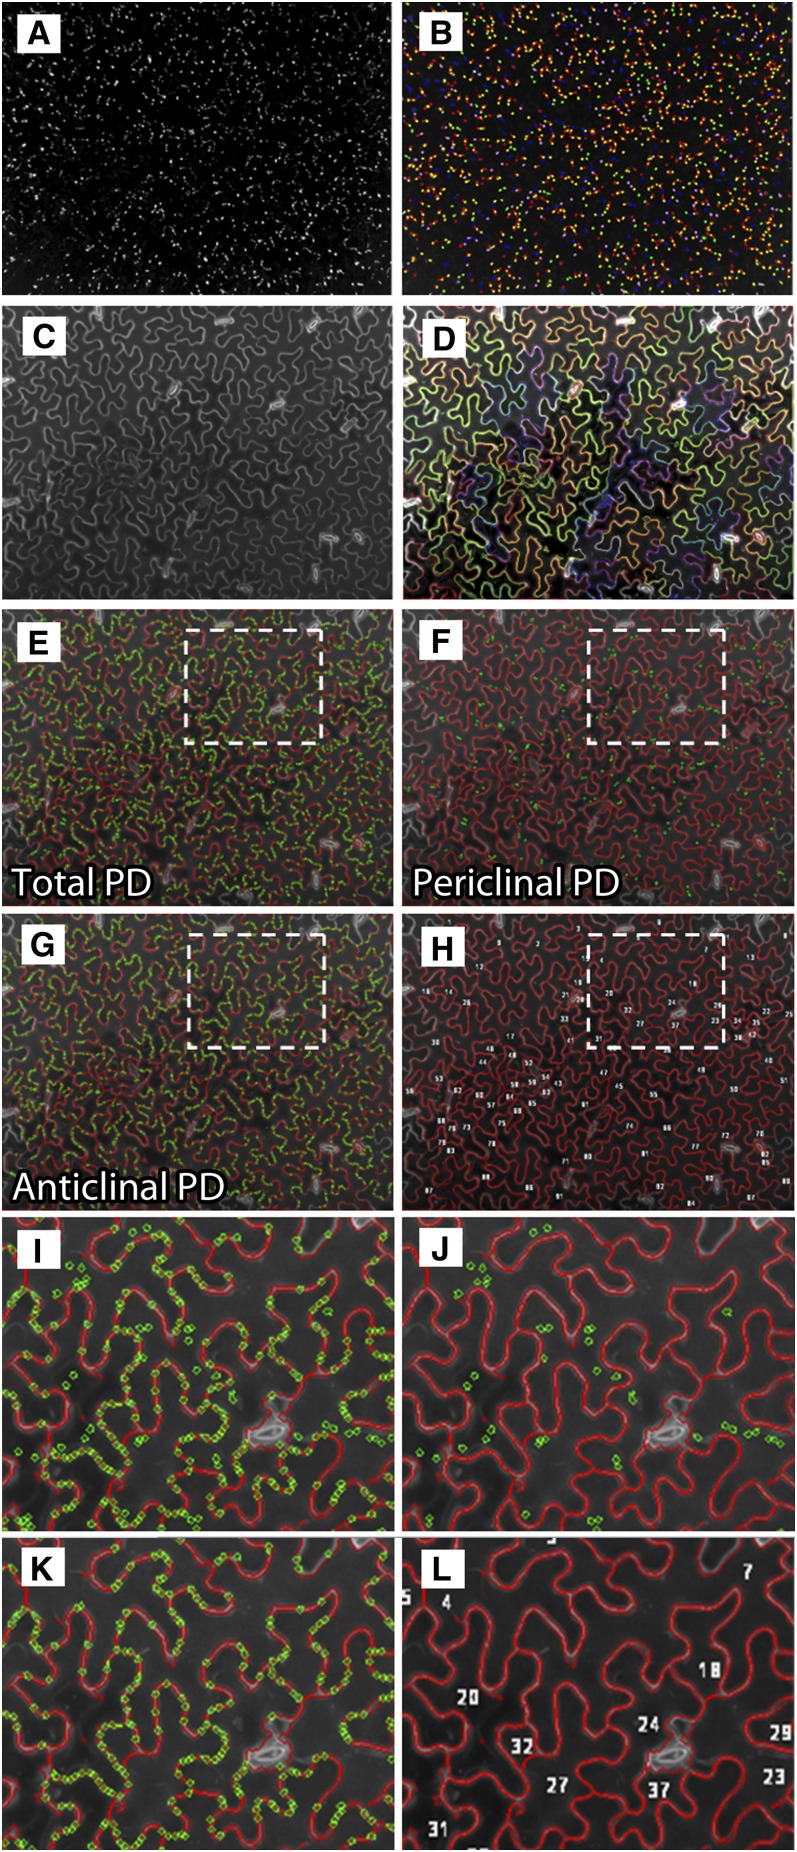
Figure 6.
The High-Throughput Analysis Workflow for Detecting PDs and Segmenting Jigsaw-Shaped Cells Using PDQUANT.
(A) A maximum intensity projection was used to merge 21 to 35 optical Z planes (image sequences in the PD channel) into a two-dimensional pseudo-image for PD signals.
(B) A set of PD candidates detected from PD images, which are presented by randomly colored circles.
(C) A maximum intensity projection was used to merge 21 to 35 optical Z planes (image sequences in the cell channel) into a two-dimensional pseudo-image for cell boundary signals.
(D) Jigsaw-shaped cells are segmented and cell boundaries are highlighted by colored lines.
(E) Detected cell boundaries (colored red) are overlapped with recognized PDs (colored green). Cells with unsuitable size (<200 μm), contrast, and location (e.g., small cells attached to the image border) are discarded.
(F) and (G) PDs overlaid with cell boundaries are categorized into the anticlinal (epidermal-epidermal) PD group, and those overlapped with cell interiors are categorized into the periclinal (epidermal-mesophyll) PD group. PDs not overlaid with any cells are discarded from the analysis.
(H) Detected cells are treated as image objects. They are labeled together with calculated features, such as size, two-dimensional coordinates, and the number of PDs per cell.
(I) to (L) High-magnification views of recognized cell boundaries showing all PDs (I), periclinal PDs (J), anticlinal PDs (K), and cell identities (L).

