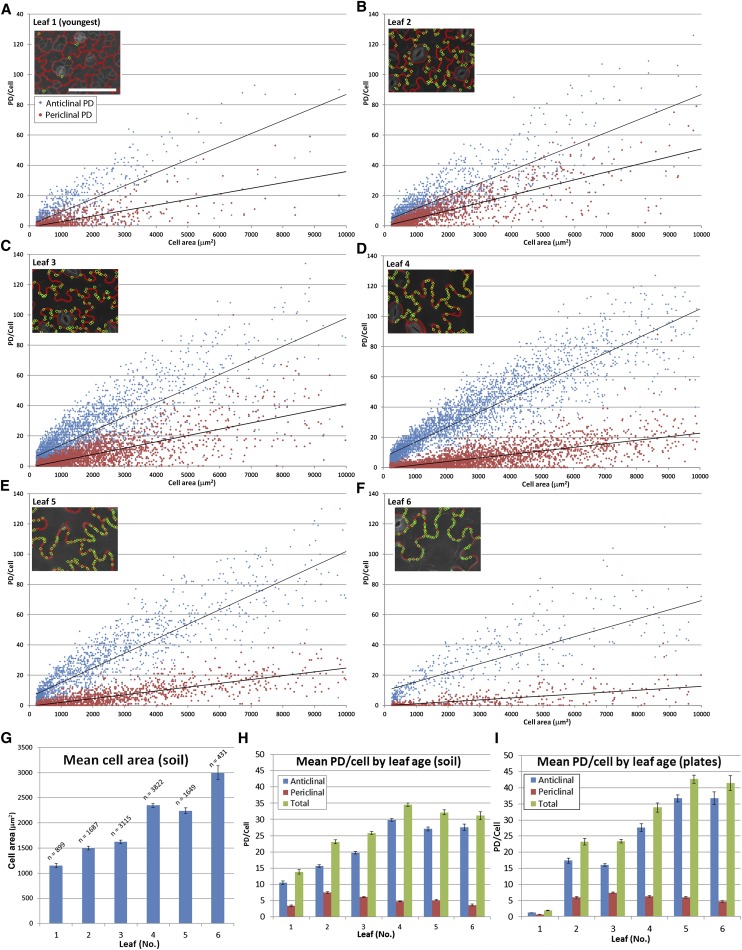
Figure 7.
Large-Scale Analysis of the Insertion of Complex PDs in the Arabidopsis Leaf Epidermis Using PDQUANT.
(A) to (F) Data for the first six emerged leaves. PD numbers and area for individual cells in both anticlinal (red) and periclinal (blue) epidermal walls are shown, with cells under 200 μm not analyzed. The insets show representative images from PDQUANT showing locations of individual complex PDs in the cell wall.
(G) Data for mean cell area of the first six leaves.
(H) Mean number of complex PDs at different epidermal interfaces for the first six leaves for plants grown on soil.
(I) Mean number of PDs at different epidermal interfaces for the first six leaves for plants grown on agar.

