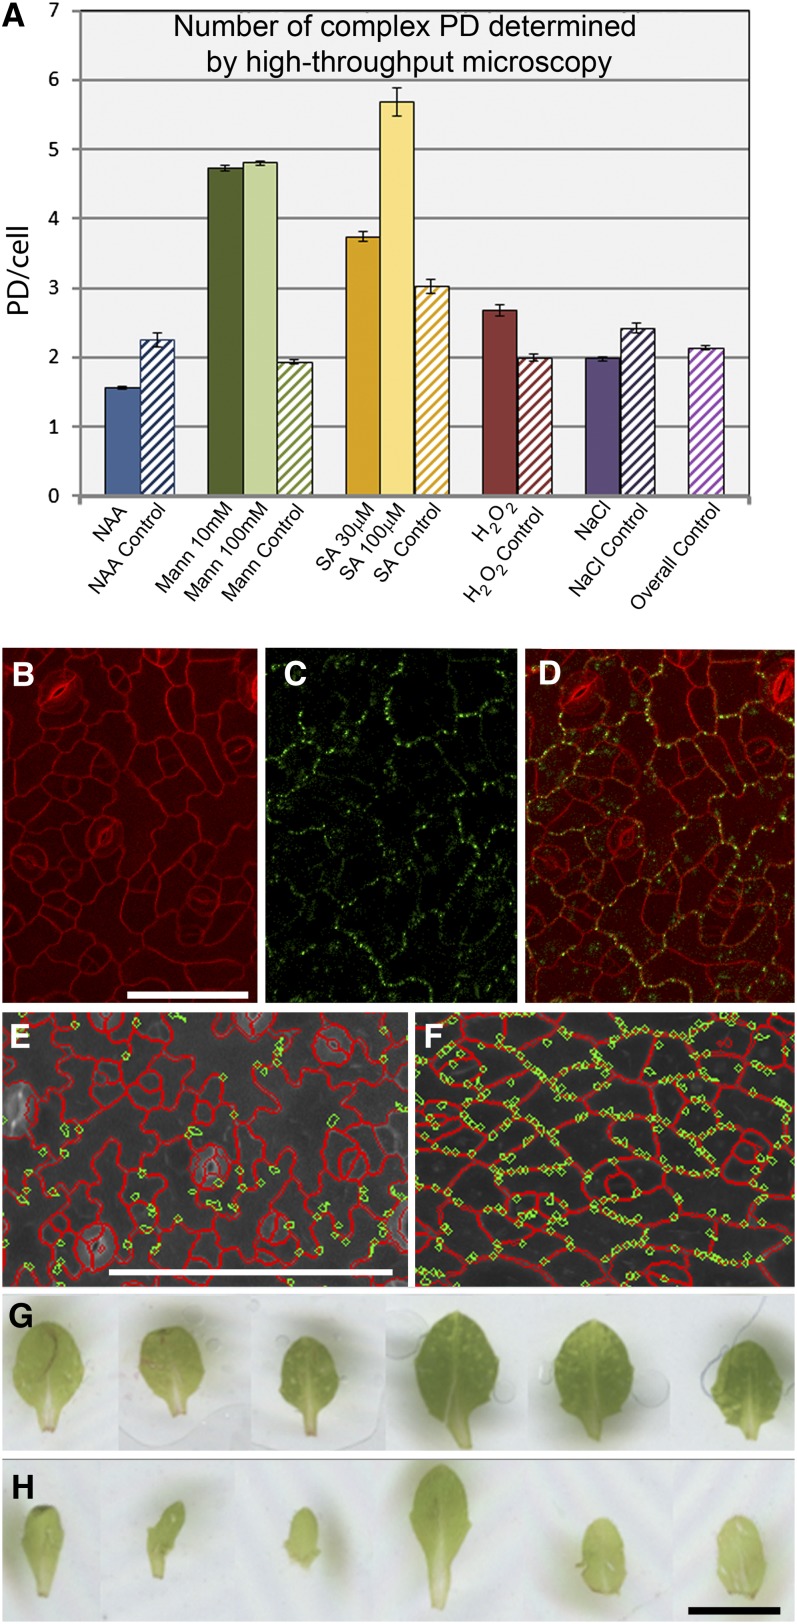
Figure 8.
Response of Complex PD Formation in Anticlinal Epidermal Interfaces to Exogenous Stresses.
(A) Numbers of complex PDs, derived using PDQUANT, in leaf 2 of plants subjected to a range of treatments (mannitol, 10 and 100 mM; H2O2, 1 mM; NaCl, 25 mM; NAA, 50 nM; SA 30 and 100 μm) and their respective controls that were performed in parallel to the treatment experiments. The “overall control” shows the average from all of the parallel control experiments combined. Mannitol and SA treatments show a significant increase (P < 0.01) in complex PD numbers.
(B) to (D) Appearance of epidermal cells from plants grown on mannitol. Lobing is absent in the pavement cells (B), and complex PDs (C) are restricted to the interfaces of the oldest epidermal cells. (D) shows the merged images. Bar = 50 μm.
(E) to (F). PDQUANT images of control (E) and 100 mM mannitol treated (F) leaves, showing detected cells (red) and PD (green). Scale = 100 μm. (G) to (H) Mannitol treatment results in narrower leaves (G) compared to control plants (H). Scale = 2 mm.

