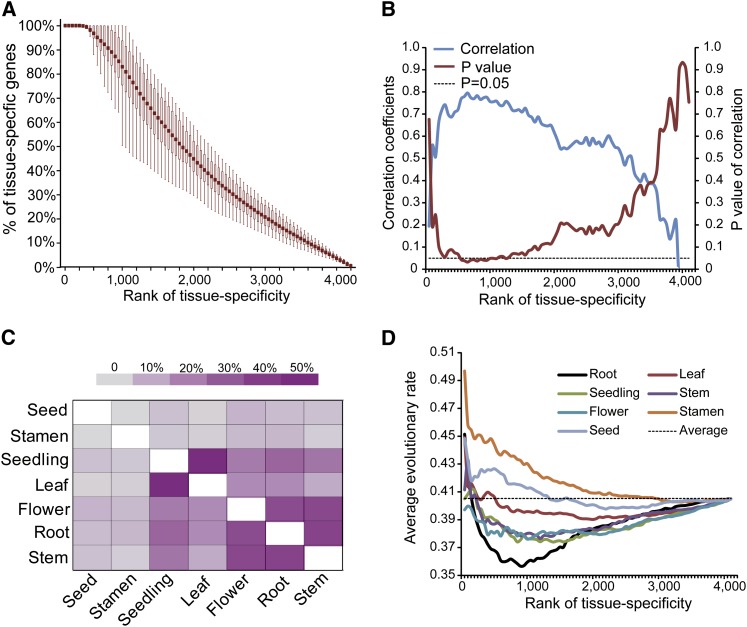
Figure 3.
Correlated Evolution of Gene Sequence and Expression Drives Organ Evolution in Plants.
(A) Each organ contains ∼400 to 500 genes with top ranks of tissue specificity unique to this organ. With a decrease in tissue specificity, the proportion of genes shared among the seven organs gradually increases. The box plot represents the distribution of the fractions of the genes that were not shared by any pair of organs at different tissue specificity ranks.
(B) Correlation between the expression divergences of the seven organs and the sequence divergences of tissue-specific genes in the seven organs. Significant correlations (Pearson r > 0.7 with P values < 0.05) were found within the range represented by ∼800 to 1200 of the most highly tissue-specific genes.
(C) Percentages of the shared genes between any pair of organs among the top 800 tissue-specific genes in each organ.
(D) Inference of the relative evolutionary rates of the seven organs. The y axis represents the average evolutionary rates of protein sequences of the top 50, 100, 150 … genes ranked by tissue specificity in the seven organs. The dashed line represents the average evolutionary rates of all 4117 orthologs.

