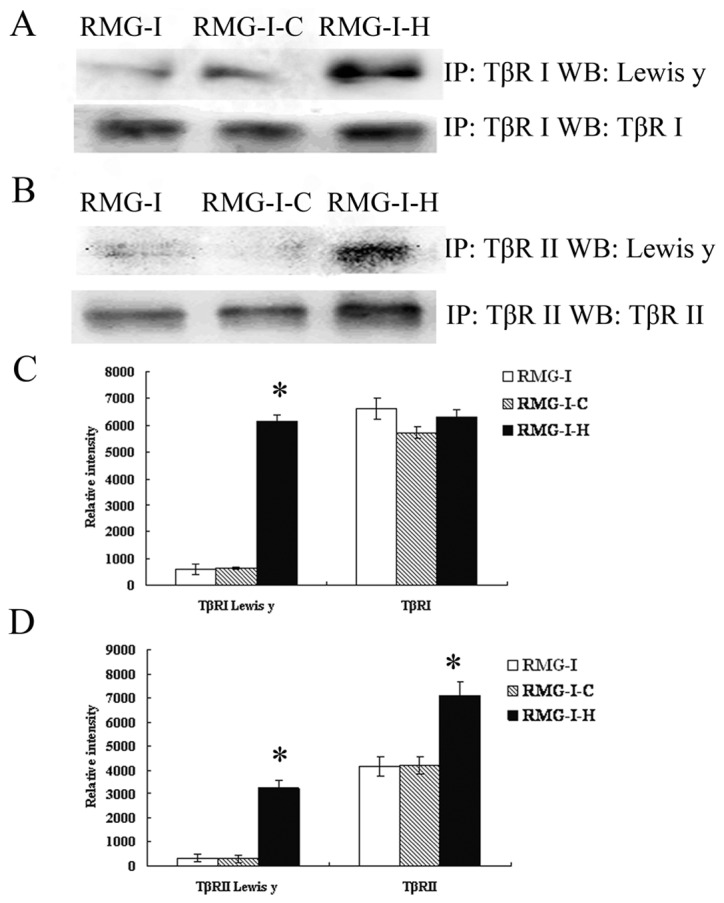
Figure 2.

Expression of LeY in TβRI and TβRII. (A, B) Following immunoprecipitation with TβRI and TβRII antibodies, Western blot analysis was performed to analyze the expression of LeY antigen and the level of TβRI, TβRII. (C, D) The relative intensity of protein levels are expressed as means in bar graphs, significant differences from RMG-I and RMG-I-C cells are noted as *p<0.01.
