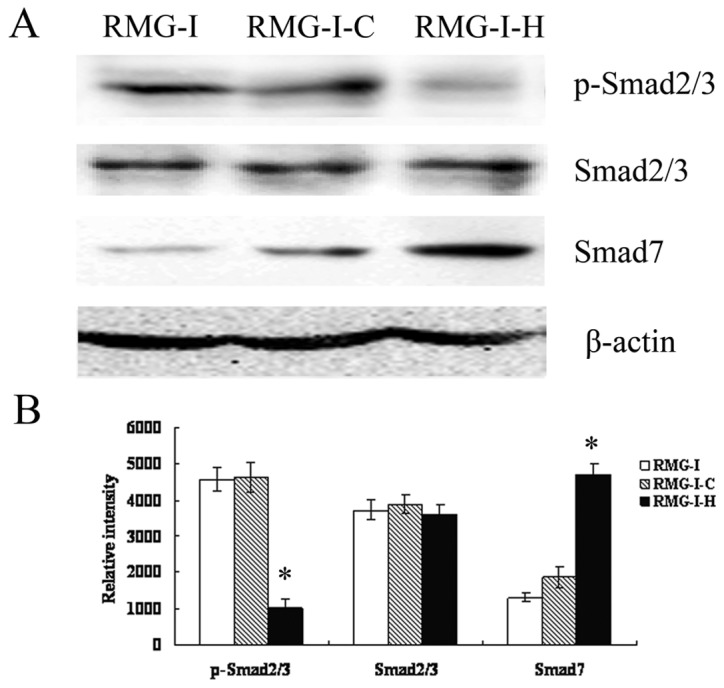
Figure 4.

Changes in the Smad pathway. (A) Western blot analysis was performed to analyze the expression of p-Smad2/3, Smad2/3 and Smad7 proteins in RMG-I, RMG-I-C and RMG-I-H cells. (B) Relative intensity of p-Smad2/3, Smad2/3 and Smad7 protein levels were expressed as means in bar graphs. Significant differences from RMG-I and RMG-I-C cells were noted as *p<0.01.
