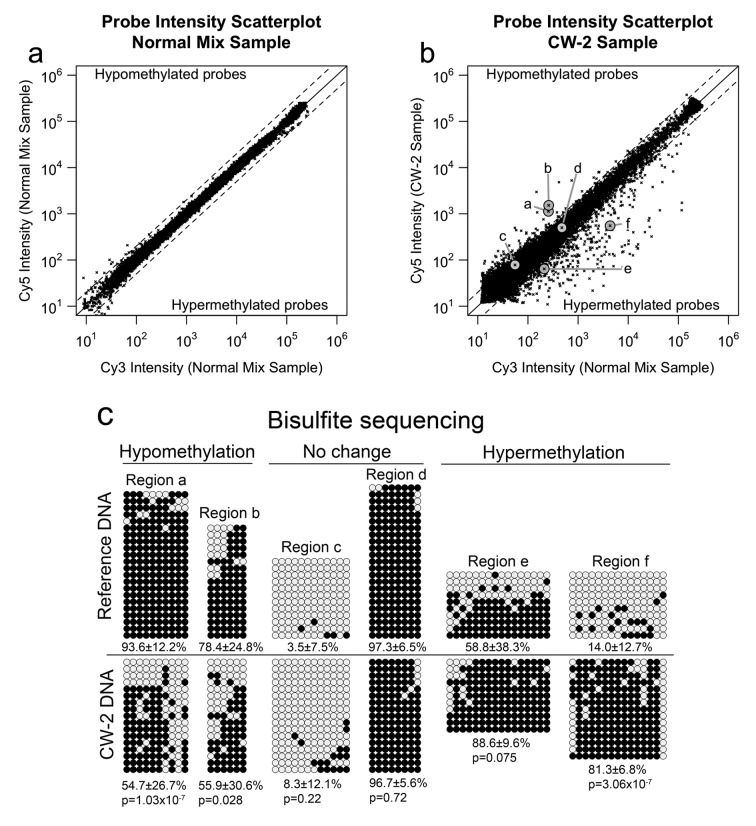
Figure 1.
Logarithmic scatterplots of the self-self hybridization (a) and the CW-2 (b) MS-AFLP array experiments. In both graphs, the solid diagonal black line indicates the log2 ratio = 0 (no change). The dashed lines indicate log2 ratio = 1 and log2 ratio = −1, used as thresholds for hypomethylation and hypermethylation cells, respectively. Six spots were selected from the CW-2 MS-AFLP array: two hypomethylated (spots a and b), two with no change (spots c and d) and two hypermethylated (spots e and f). The methylation of the NotI sites associated to these spots was analyzed by bisulfite sequencing (c). Every row of circles represents the sequence of an individual clone. Black circles represent metyhylated CpG sites while white circles represent unmethylated CpG sites. For every region, the methylation fraction was calculated by averaging the methylation level of every individual clone. Statistical significance of the methylation fraction differences was analyzed by Wilcoxon rank sum test.

