
Figure 3.
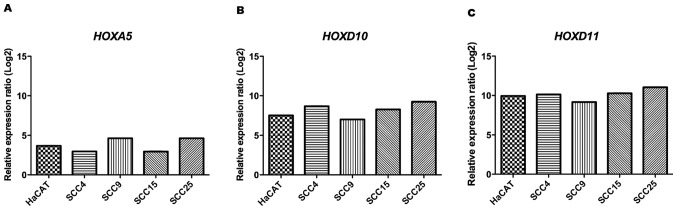
Relative expression ratio (log2) of HOXA5, HOXD10 and HOXD11 mRNA expression analysis by qRT-PCR in HaCAT and OSCC cell lines (SCC4, 9, 15, 25). Significant up-regulation of these genes was observed in all cell lines compared with that in NOK (p<0.001, one-way ANOVA).