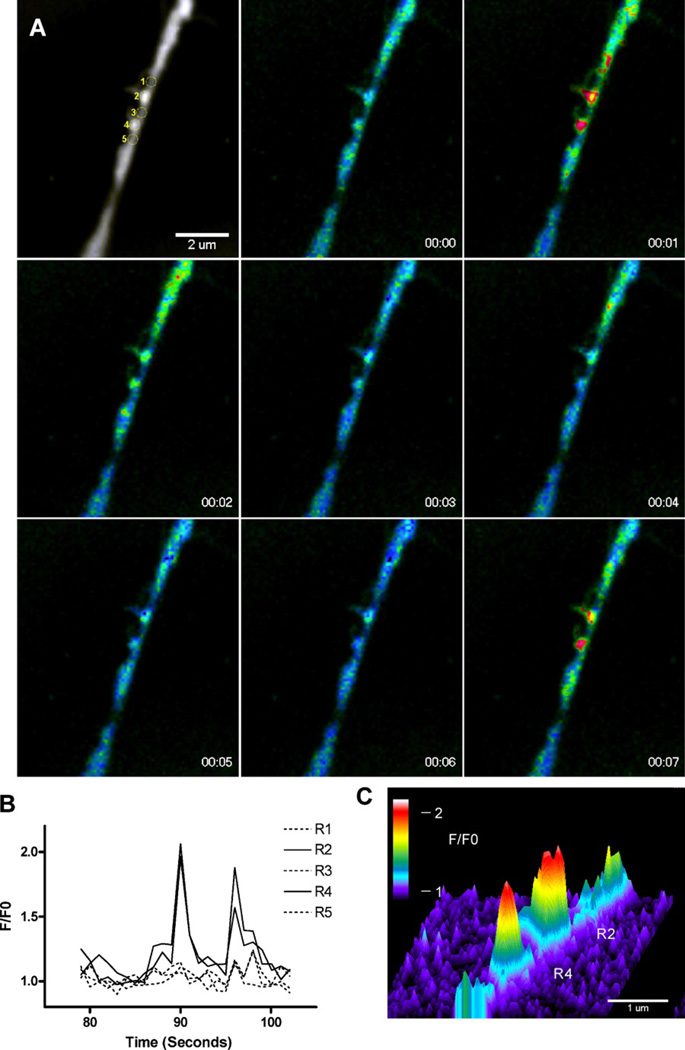
Figure 6. The spatiotemporal profile of the unitary Ca2+ events (“blinks”).
A) Sequential images from a time series showing two Ca2+ blinks separated by 1.1 µm in a single filopodia. Top left image shows the regions used for measurements overlaid on the fluorescence image, subsequent F/F0 images were captured every second during application of nicotine + PNU-120596. B) Time-course of the F/F0 in two regions (#2 and #4) that exhibit repetitive Ca2+ elevations lasting ~3 s and in contiguous regions (#1, #3, and #5) that did not display considerable Ca2+ activity. C) Intensity profile of the F/F0 signal at t = 1 s in regions #2 and #4, showing the spatial spread of the Ca2+ elevations. The cross-section at >20% of the peak fluorescence averaged 0.67 µm and 0.64 µm for regions #1 and #2, respectively. Cell calcium by CHURCHILL LIVINGSTONE. Reproduced from with permission of CHURCHILL LIVINGSTONE in the format Journal via Copyright Clearance Center.

