
Fig. 3.
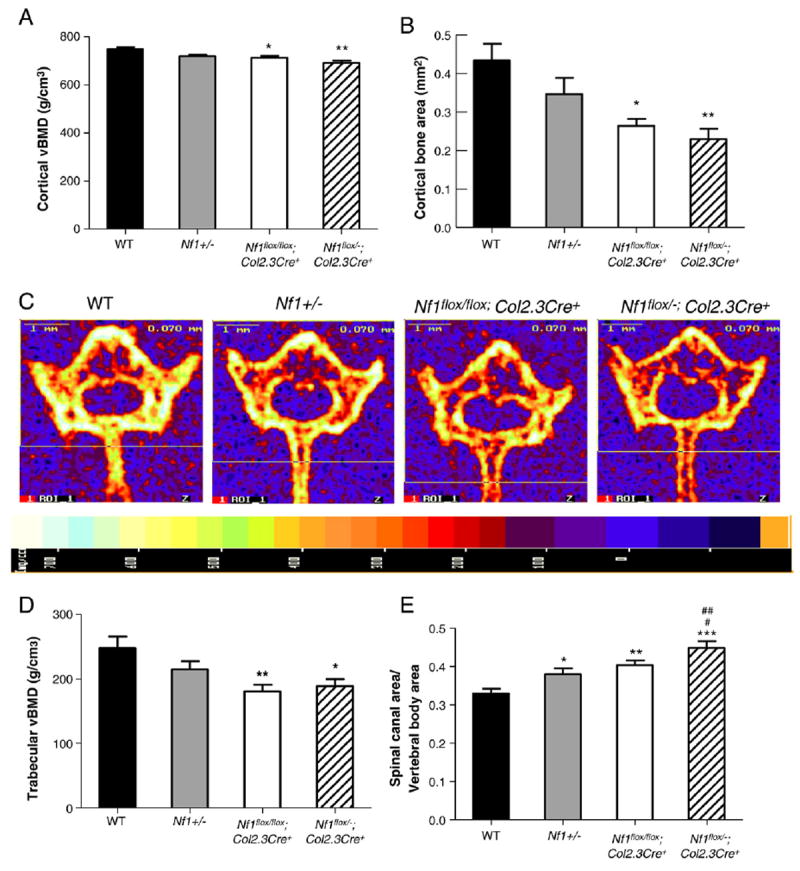
Nf1flox/−;Col2.3Cre+ mice have reduced cortical bone area and bone mineral density. (A) Cortical bone mineral density of L5 at the midpoint between the rostral/caudal margin of the pedicle in four different genotypes is shown. Data represent mean ± SEM of 9–10 mice per genotype. *p<0.05 Nf1flox/flox;Col2.3Cre+ vs WT. **p<0.001 Nf1flox/−;Col2.3Cre+ vs WT. (B). The cortical bone area in the L5 vertebral body was compared between the 4 groups of mice. Data represent mean ± SEM of 9–10 mice per genotype. *p<0.01 Nf1flox/flox;Col2.3Cre+ vs WT. **p<0.01 Nf1flox/−;Col2.3Cre+ vs WT. (C) Representative pQCT cross sections from L5 of four genotypes of mice. The relative intensity of bone is shown in the bottom panel. (D) The trabecular vBMD in the L5 vertebral body was compared between the 4 groups of mice. Data represent mean ± SEM of 9–10 mice per group. **p<0.01 Nf1flox/flox;Col2.3Cre+ vs WT. *p<0.05 Nf1flox/−;Col2.3Cre+ vs WT. (E) The ratio of spinal canal area/vertebral body area was compared between the 4 groups of mice. Data represented mean ± SEM of 9–10 mice per genotype. *p<0.05 Nf1+/− vs WT. **p<0.01 Nf1flox/flox;Col2.3Cre+ vs WT. ***p<0.001 Nf1flox/−;Col2.3Cre+ vs WT. #p<0.05 Nf1flox/flox;Col2.3Cre+ vs Nf1flox/−;Col2.3Cre−. ##p<0.01 Nf1flox/−;Col2.3Cre+ vs Nf1+/−.