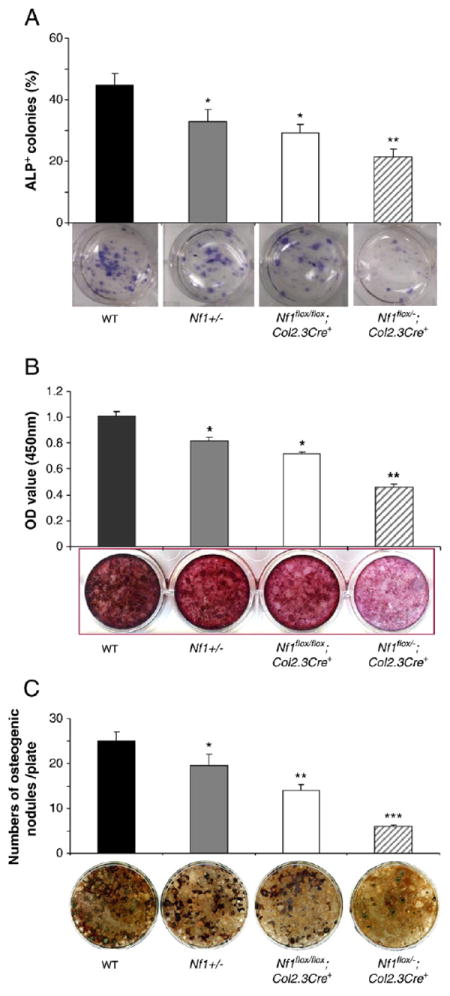
Fig. 6.

Impaired osteoblast differentiation in Nf1 deficient mice in vitro. (A) Quantitative evaluation of ALP+ colony formation in primary osteoblast cultures from four genotypes of mice. Data represent mean ± SEM of triplicate cultures from each mouse. Three mice were used for each experiment per genotype. Three independent experiments were conducted with similar results. *p<0.05 for comparing Nf1+/− vs. WT mice, or Nf1flox/flox;Col2.3Cre+ mice vs. WT mice, and **p<0.01 for comparing Nf1flox/−;Col2.3Cre+ mice vs. three other groups of mice. The lower panel shows representative photographs of each culture. (B) Quantitative evaluation of osteoblast differentiation following Alizarin staining. Data represent the mean ± SEM of triplicate cultures per mouse and three mice were used per condition per genotype. Three independent experiments were conducted. *p<0.05 for comparing Nf1+/− with WT mice, or Nf1flox/flox;Col2.3Cre+ mice vs. WT mice, and **p<0.01 for comparing Nf1flox/−;Col2.3Cre+ mice vs. the other three groups of mice. (C) Quantitative evaluation of osteogenic nodules of four genotypes of mice following von Kossa staining. Data represent the mean ± SEM of triplicate cultures, and three mice were used in each group. Three independent experiments were conducted with similar results. *p<0.05 for comparing Nf1+/− vs. WT mice, **p<0.01 for comparing Nf1flox/flox;Col2.3Cre+ mice vs. WT mice, and ***p<0.001 for comparing Nf1flox/−;Col2.3Cre+ mice vs. the other three groups of mice. Representative photomicrographs of osteogenic nodules are shown in the lower panel.
