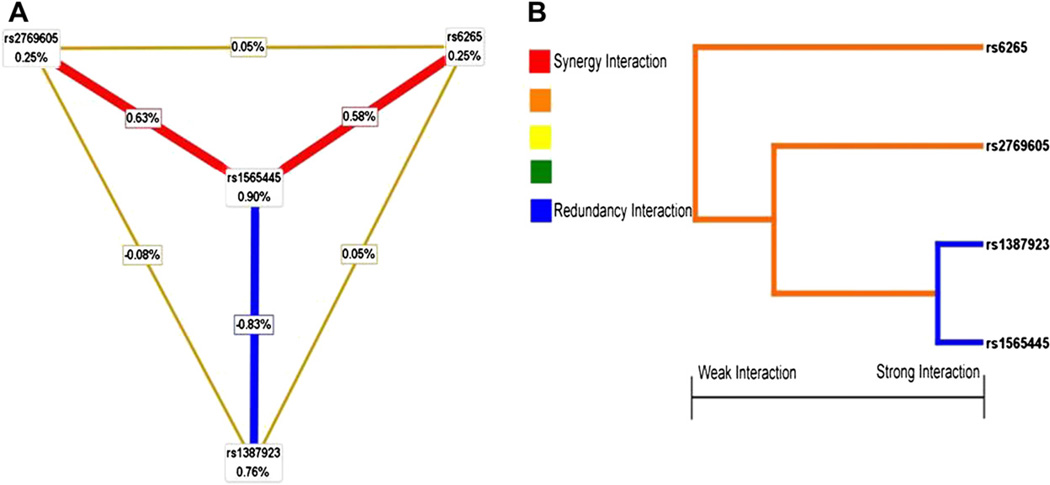
Fig. 2.
Hierarchical interaction graphs and interaction dendrogram. (A) Hierarchical interaction graphs showed that the percentage at the bottom of the each polymorphism represented entropy of it, and the percentage on each line represented the interaction percentage of entropy between two polymorphisms. The red line represented synergy redundancy interaction and the blue line represented redundancy interaction. (B) Interaction dendrogram showed that the red line represented synergy redundancy interaction and the blue line represented redundancy interaction. From left to right the interaction was more intensive. (For interpretation of the references to color in this figure legend, the reader is referred to the web version of this article.)

