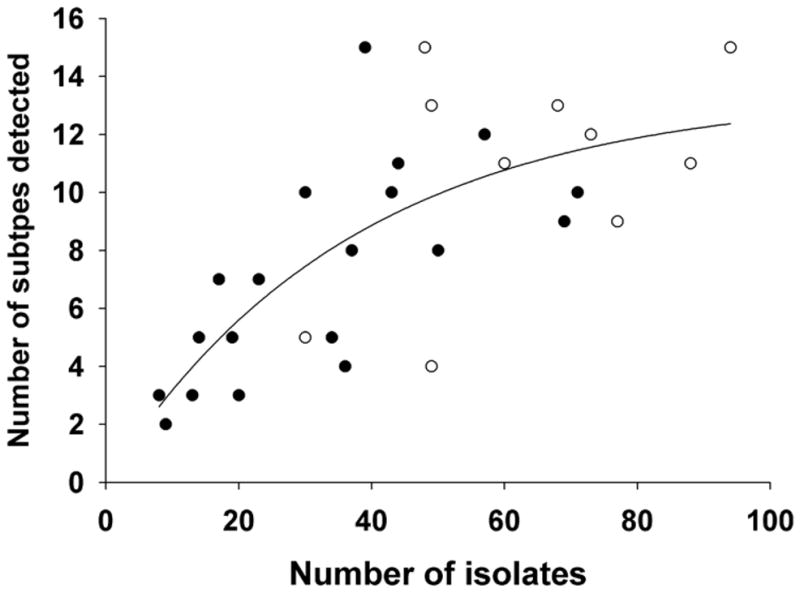
Figure 1.

Detected subtype diversity as a function of sampling effort. Solid circles are results from individual sampling efforts by SCWDS and SJCRH. Open circles are the combined data for individual years. The nonlinear regressions line (R2= 0.514) was calculated based on an exponential, single, 2 parameter model and using SigmaPlot 10 software (Systat Software, Inc., Richmond, California, USA).
