
Figure 3.
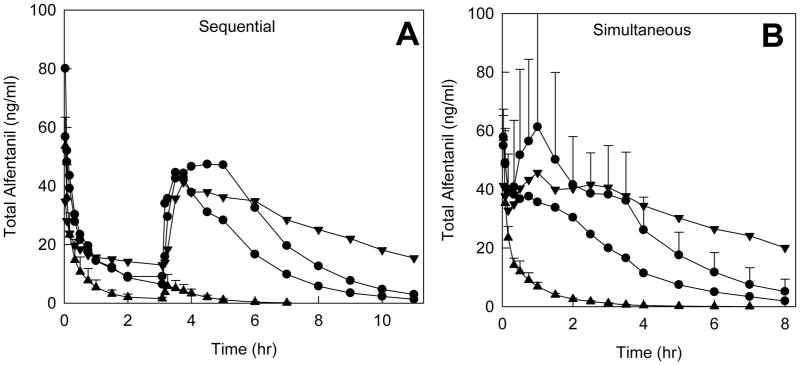
Effect of CYP3A induction and inhibition on total (d0 and d3-ALF) plasma concentrations. Drug doses and symbols are the same as described in the legends to Figs 1 and 2. Panels A and B show results for sequential and simultaneous IV and oral ALF administration, respectively. Results are the mean (n=6); SD are omitted for clarity.