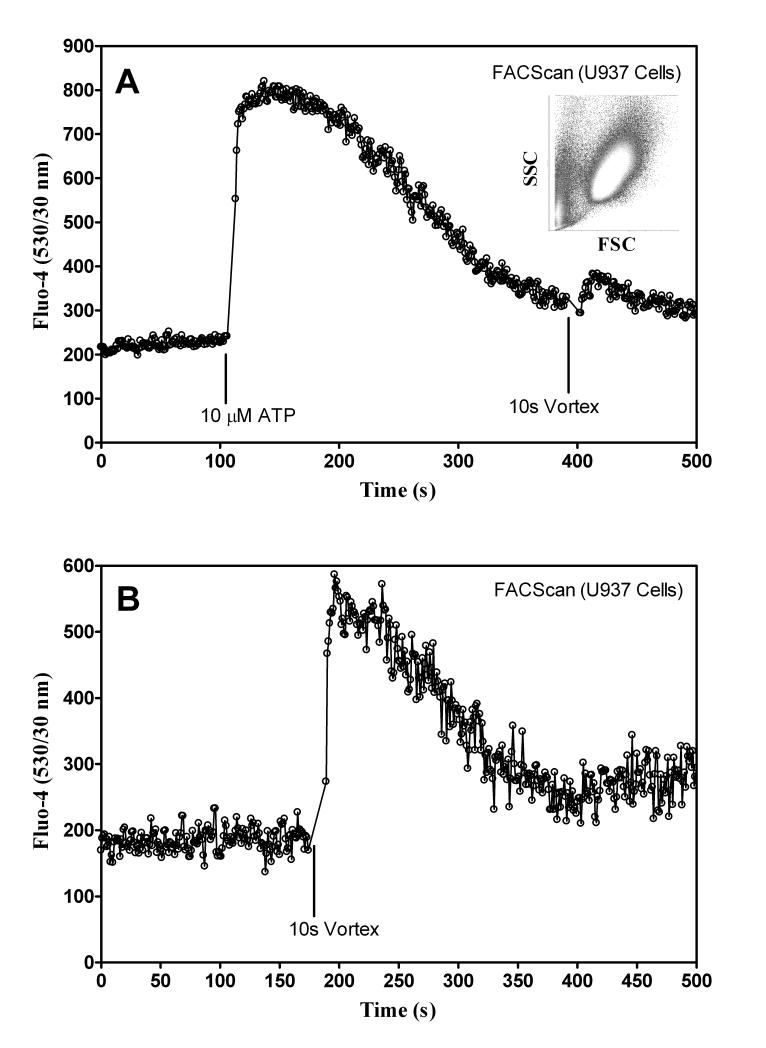
Figure 2.
Testing responsiveness of U937 Cells. A) U937 cells were stained with Fluo-4. Then cells were sampled with the FACScan for 120 s, 10 μM ATP was added, and sampling resumed. At 380 s the sample was vortexed for 10 s and then sampling resumed. Inset shows typical raw forward and side scatter data used as a gate for final plots. B) U937 cells sampled with FACScan only and vortexed for 10 s.

