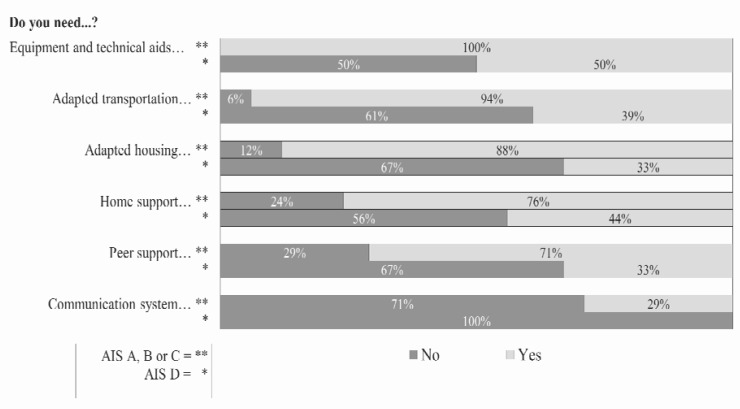
Figure 2.
Needs of family members (n=21). Percentages expressed in the graphic can be understood in the following manner: first percentage on the left represents participants who do not have the need mentioned in the list. Other percentages (on 100%) include all participants who stated having the need and correspond to the degree in which they say their need is met.

