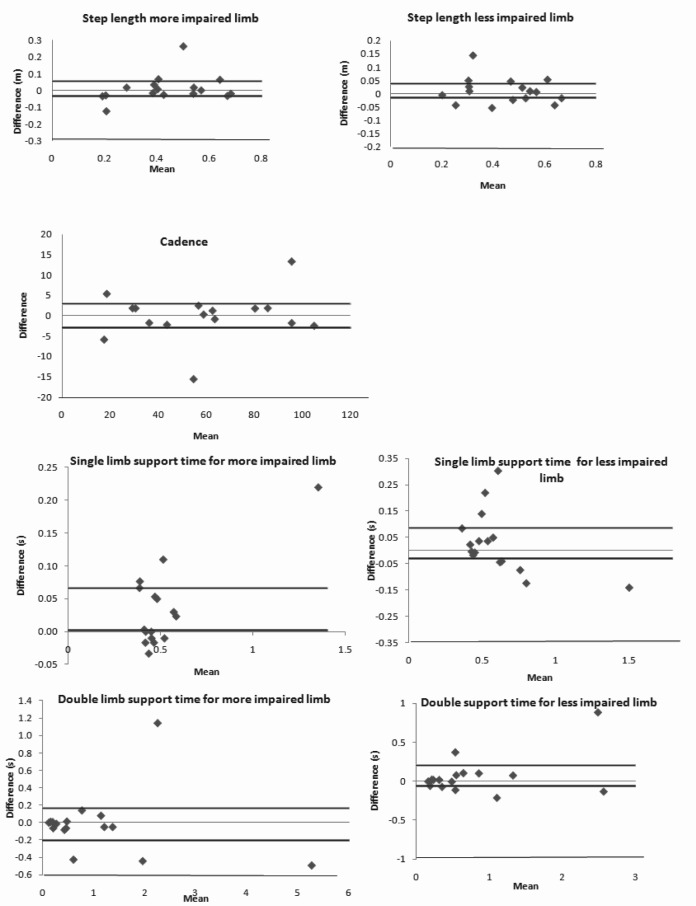
Figure 1.
The Bland Altman plots the difference between the first and the second session against the mean of the 2 sessions for the ST parameters. The plots for step length, single limb support time, double limb support time, and for cadence demonstrate no systematic variation in group performance between sessions for all the ST parameters except for single limb support time on the more impaired limb and non-uniform relationships between the mean and the difference between the sessions for single limb support time on the less impaired limb. Solid black line represents the 95% confidence interval for the difference and the grey line represents zero.

