
Fig 1.
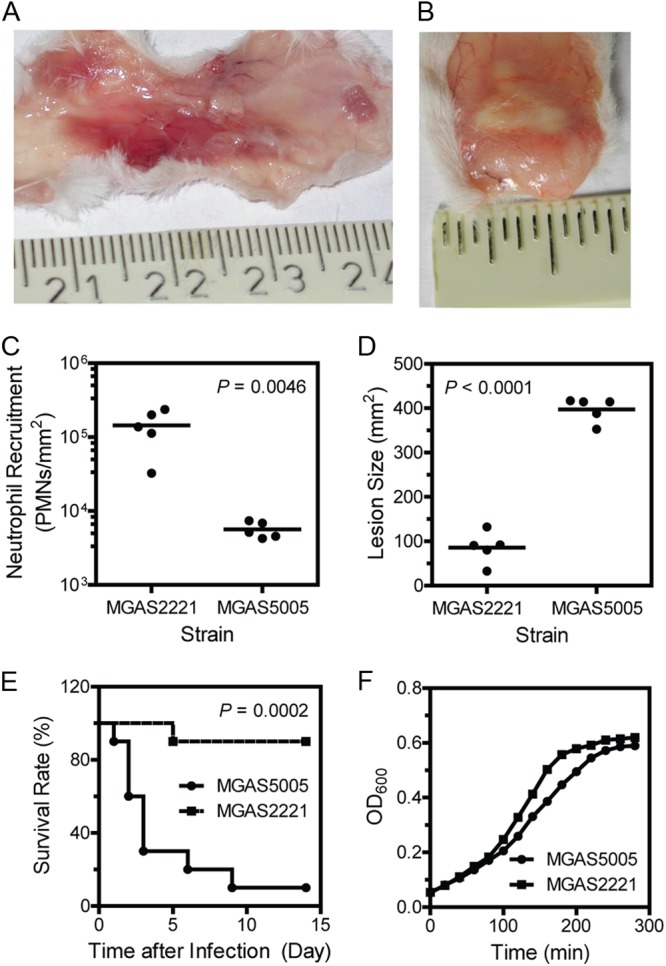
Distinct phenotypes of M1T1 GAS strains MGAS2221 and MGAS5005 in subcutaneous infections of mice. Inside-out pictures of MGAS5005 (A) and MGAS2221 (B) skin infection sites were taken at 24 h after inoculation. (C and D) Neutrophil recruitment at (C) and size of (D) the skin infection sites of mice infected with 1.0 × 10⁸ CFU MGAS2221 or 9.1 × 10⁷ CFU MGAS5005. (E) Survival rates of mice infected with 1.5 × 10⁸ CFU MGAS2221 or 1.0 × 10⁸ CFU MGAS5005. (F) Growth curves of MGAS5005 and MGAS2221 in THY. Each culture at the mid-exponential growth phase was diluted at time zero to start measurements of OD600 over time.