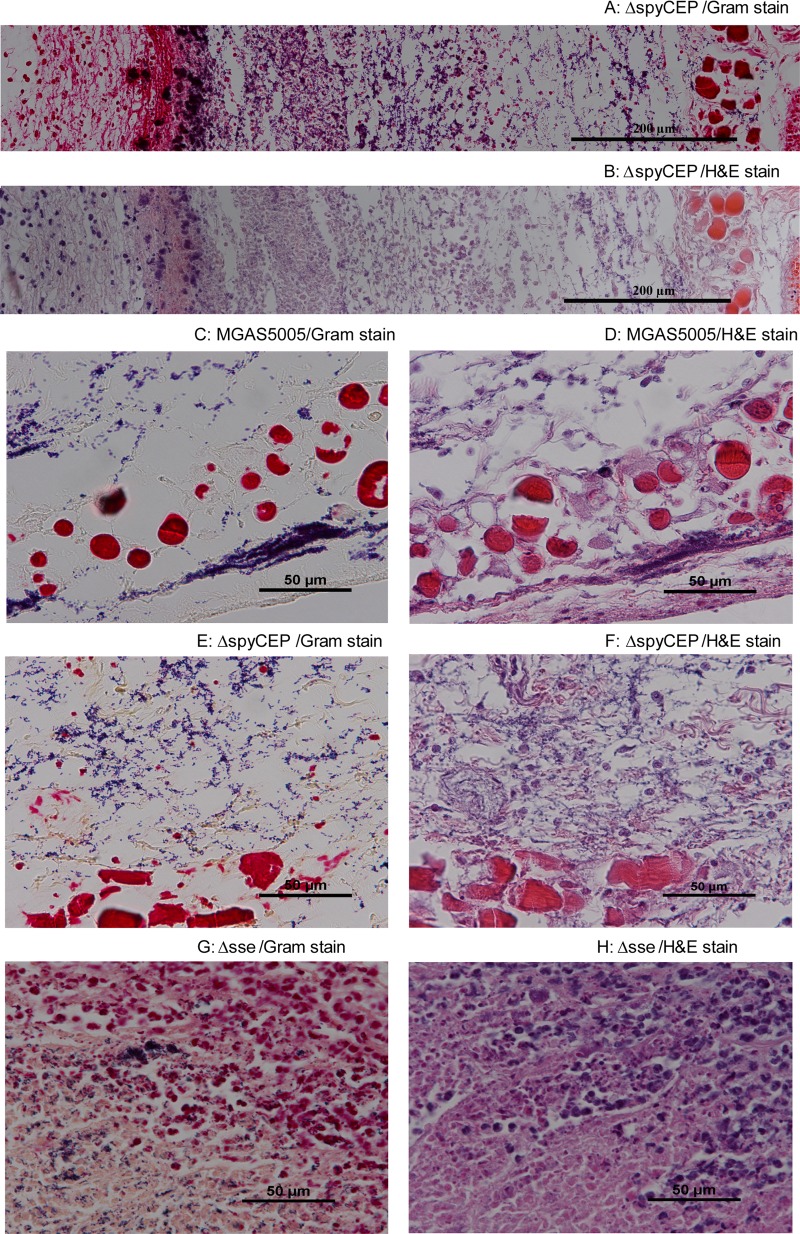
Fig 5.
Histological analyses showing no difference in the pattern or level of neutrophil infiltration between MGAS5005 and MGAS5005ΔspyCEP. CD1 mice were subcutaneously inoculated in the back with 1.1 × 10⁸ CFU MGAS5005, 1.0 × 10⁸ CFU MGAS5005ΔspyCEP, or 1.3 × 10⁸ CFU MGAS5005Δsse, and skin samples were collected at 24 h after inoculation. (A and B) Microscopic pictures of Gram (A)- and H&E (B)-stained MGAS5005ΔspyCEP samples at the inoculation site were each combined from three snapshots taken at a magnification of ×40. (C to F) Microscopic images of Gram (C and E)- and H&E (D and F)-stained skin samples at the spread areas of MGAS5005 (C and D) and MGAS5005ΔspyCEP (E and F) infection sites. (G and H) Microscopic images of Gram (G)- and H&E (H)-stained skin samples from an MGAS5005Δsse infection site.

