
Fig 2.
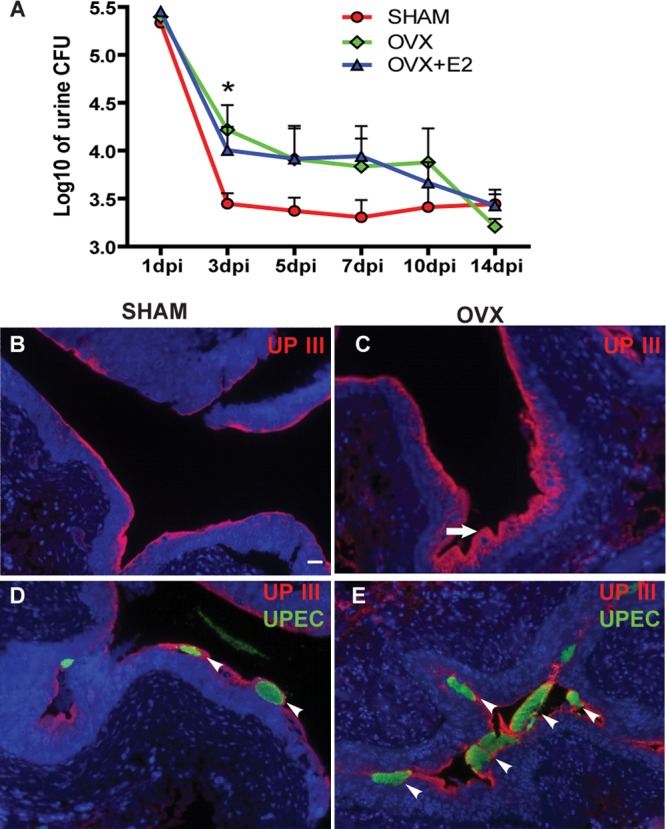
Ovariectomized mice exhibit prolonged infection. (A) CFU counts of bacteriuria over a time course in SHAM, OVX, and OVX+E2 mice plotted as means ± standard errors of the means (SEM) of the log10 value (n = 6 to 12 mice/time point/group in two experiments). *, P < 0.05 (between SHAM and OVX mice by two-way ANOVA with a Bonferroni posttest). (B to E) Immunofluorescence (IF) analysis reveals more UPIII+ (red) superficial cells in OVX mice than SHAM mice at 24 hpi (B and C), as well as more intracellular UPEC communities (green) (D and E). Bar = 20 μm.