
Fig 3.
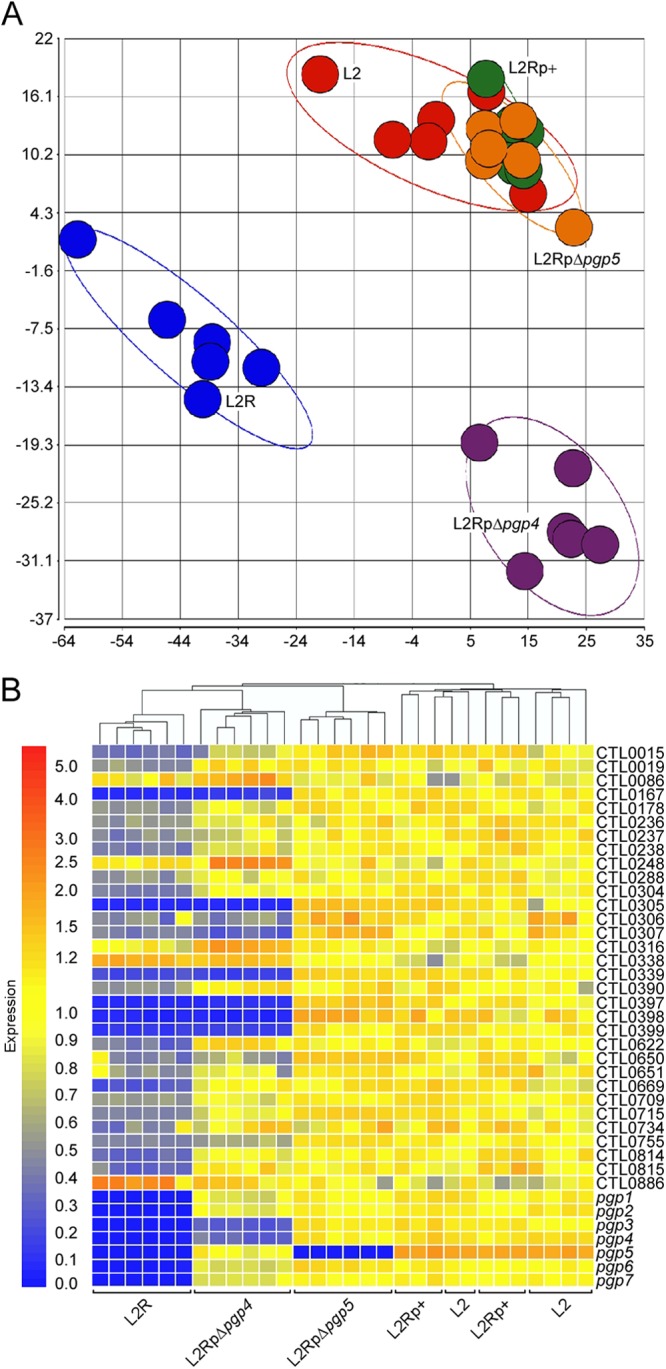
Microarray analyses identify Pgp4 as a transcriptional regulator of plasmid and chromosomal genes. (A) Principal components analysis of quantile-normalized microarray data of strains L2, L2R, L2p+, L2RpΔpgp4, and L2RpΔpgp5 at 24 h p.i. Each colored circle represents all C. trachomatis data produced from a single chip, and grouping and separation of replicates and strains, respectively, are demonstrated by each colored ellipse (red, L2; blue, L2R; green, L2Rp+; purple, L2RpΔpgp4; orange, L2RpΔpgp5). (B) Hierarchical cluster analysis of microarray results showed a close association in gene expression between L2RpΔpgp4 and L2R. Thirty-nine genes that passed the test criteria in at least one microarray comparison analysis were selected. Four pairwise comparisons were performed: L2 versus L2R, L2 versus L2Rp+, L2Rp+ versus L2pΔpgp4, and L2Rp+ versus L2RpΔpgp5. Yellow indicates signal intensity equal to the reference intensity of L2; red indicates a greater intensity, and blue indicates a lower intensity.