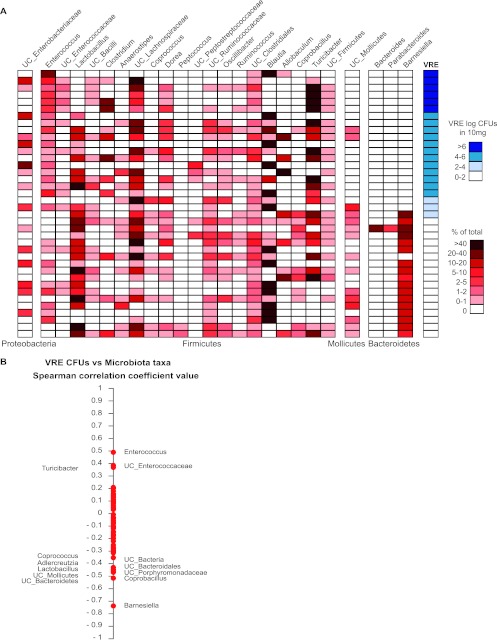
Fig 4.
Colonization with the Barnesiella genus correlates with VRE elimination. (A) Genus level composition of the fecal microbiota (red heat map) and VRE CFU levels (blue heat map) for the different mice described in Fig. 2 5 weeks after VRE infection. Only the microbial taxa representing at least 1% of the microbiota are shown. Each heat map row represents one mouse, and mice are sorted by VRE colonization levels in descending order. (B) Spearman correlation analysis of the different bacterial genera present in the fecal microbiota of mice with the VRE CFU levels 5 weeks after infection. Spearman correlation coefficient values range from +1 (maximum positive correlation value) to −1 (maximum inverse correlation value). Each point represents one genus. To analyze the statistical significance of a given coefficient Spearman value, P values were computed using the asymptotic t approximation. Spearman coefficient values with a P value of <0.05 are indicated.

