Fig 3.
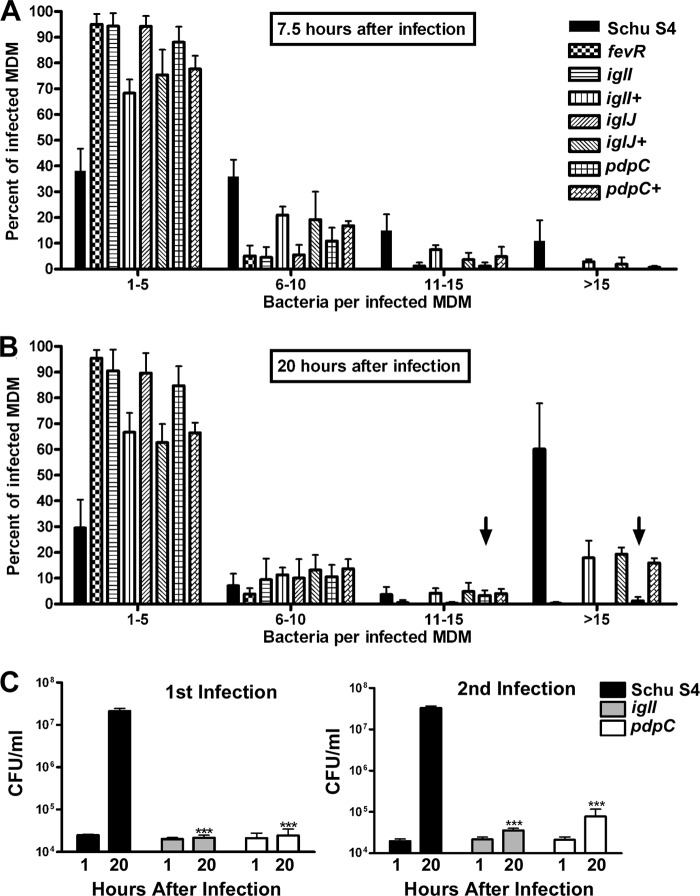
Quantitation of bacterial growth in macrophages using microscopy to analyze individual infected cells. (A and B) MDMs were infected for 7.5 h (A) or 20 h (B) with the indicated strains of bacteria and then analyzed by immunofluorescence microscopy. The number of bacteria per infected MDM was scored, and the data were grouped into four categories: 1 to 5, 6 to 10, 11 to 15, and >15 bacteria per cell. At least 100 infected MDMs were counted at each time point per experiment (n ≥ 3). Arrows highlight data that suggest low- level replication of the pdpC mutant strain at 20 h. The percentages of MDMs infected were similar for all strains (data not shown). (C) MDMs were infected for 1 h at an MOI of 20:1 in medium containing 10% human serum and washed, and CFU were enumerated at 1 and 20 h p.i. Viable recovered bacteria were then used to infect a second set of MDMs. ***, P < 0.001 versus Schu S4. The error bars indicate SD.

