
Figure 3.
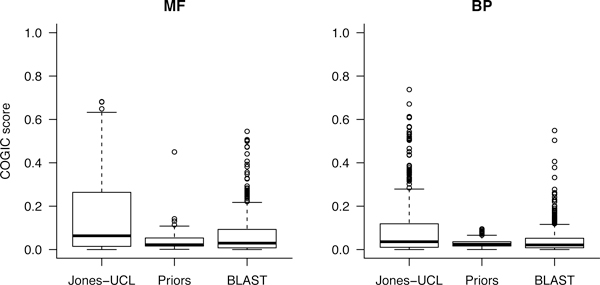
Performance comparison based on COGIC scores. The boxplot recapitulates the target-based distributions for the Jones-UCL prediction team as well as for the naïve algorithms Priors and BLAST.
Official websites use .gov
A
.gov website belongs to an official
government organization in the United States.
Secure .gov websites use HTTPS
A lock (
) or https:// means you've safely
connected to the .gov website. Share sensitive
information only on official, secure websites.
Performance comparison based on COGIC scores. The boxplot recapitulates the target-based distributions for the Jones-UCL prediction team as well as for the naïve algorithms Priors and BLAST.