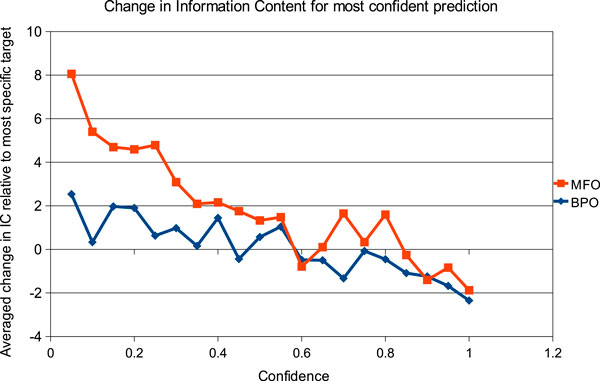
Figure 4.

Relationship between confidence scores and GO term specificity. Positive values indicate that on average the assignments made by the team Jones-UCL at a given confidence level were more specific than the corresponding experimental annotations. Negative values indicate the converse. Molecular Function (MF) and Biological Process (BP) data were analysed and plotted separately.
