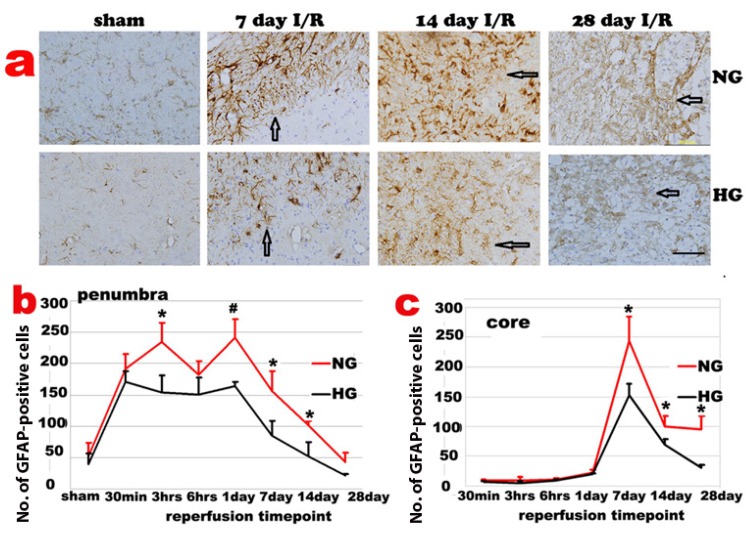
Fig 4.
Changes of GFAP-positive cells after ischemia and reperfusion (I/R) in normo- and hyperglycemic rats after various reperfusion stages. a, Representative photomicrographs showing GFAP staining in the ischemic core area in normoglycemic (NG) and hyperglycemic (HG) animals. Brown color represents GFAP positive stained astrocytes. Bar =100 µm. b, Temporal profile of GFAP positive staining in the penumbra. c, Temporal profile of GFAP positive staining in the ischemic core, Arrows indicate GFAP positively stained astrocytes. *p<0.05 vs. sham control and #p<0.01 vs. same HG at an identical reperfusion stage.

