
Figure 2.
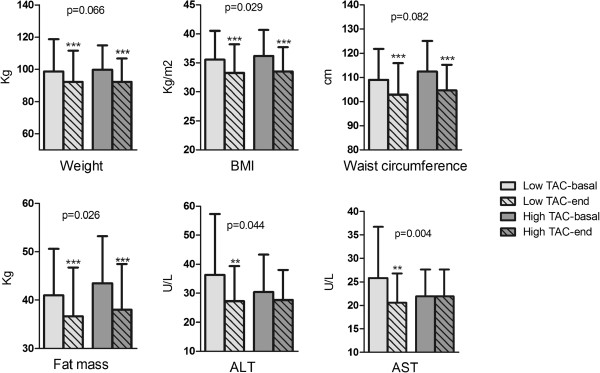
Changes on selected parameters categorized by low (<10.629 mmol day-1, n = 45) or high (>10.629 mmol day-1, n = 45) Total Antioxidant Capacity. BMI: Body Mass Index; ALT: Alanine aminotransferase; AST: Aspartate aminotranferase. p-values comparing the differences between low-TAC and high-TAC groups.