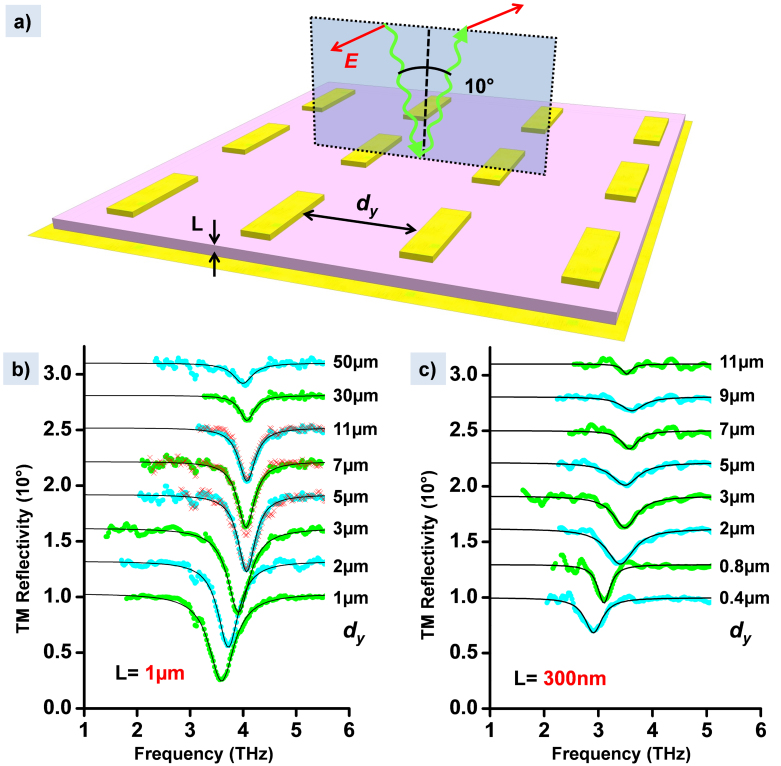
Figure 2. Experimental characterization of the arrays.
(a) Experimental configuration for reflectivity measurements performed at 10° incidence on arrays, with variable thickness L and lateral spacing dy. The electric field E of the incident wave has also been indicated. (b,c) Reflectivity spectra obtained with thickness L = 1 μm (b) and L = 300 nm (c). The corresponding spacings dy are indicated on the right. The experimental data is indicated by dotted curves, and the continuous lines are Lorentzian fits. The crossed curves indicate measurements from a repeat sample with the same parameters as the one indicated. The curves are shifted with a constant offset for clarity.

