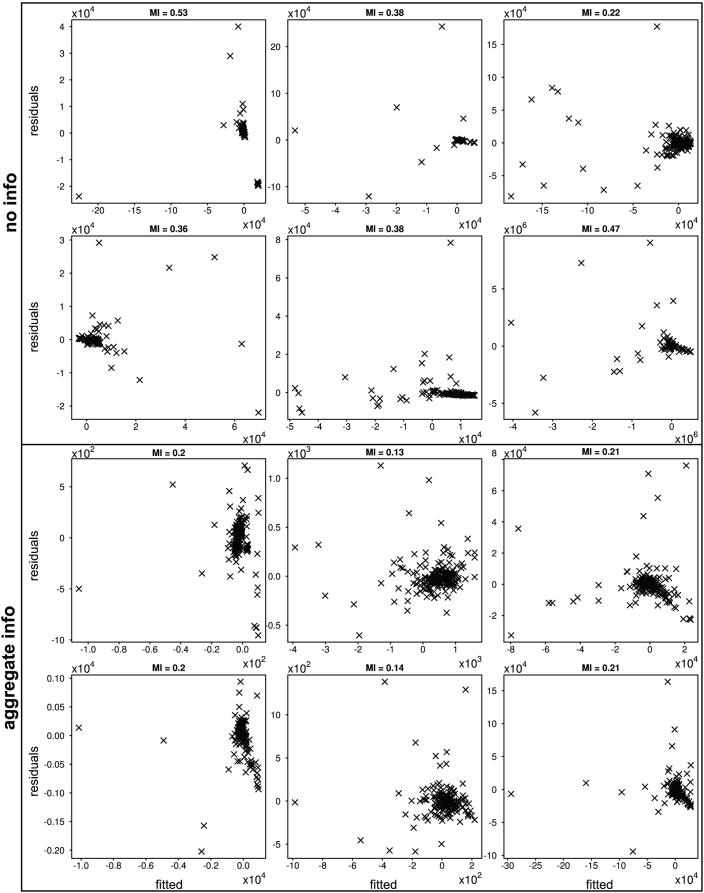
Figure 2. Residuals vs. fitted values for both information conditions and all questions.
The first two rows show the no-information condition, while the last two – the aggregate information condition. Questions are numbered from left to right and top to bottom. The mutual information (MI) is shown on top of each plot (see Methods for definition of MI).

