
Figure 2.
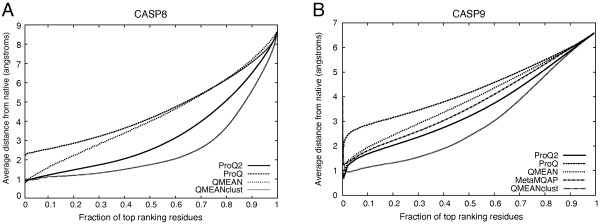
Local quality prediction performance as measured by the average distance deviation for different fraction of top ranking residues for CASP8 (A) and CASP9 (B).
Official websites use .gov
A
.gov website belongs to an official
government organization in the United States.
Secure .gov websites use HTTPS
A lock (
) or https:// means you've safely
connected to the .gov website. Share sensitive
information only on official, secure websites.
Local quality prediction performance as measured by the average distance deviation for different fraction of top ranking residues for CASP8 (A) and CASP9 (B).