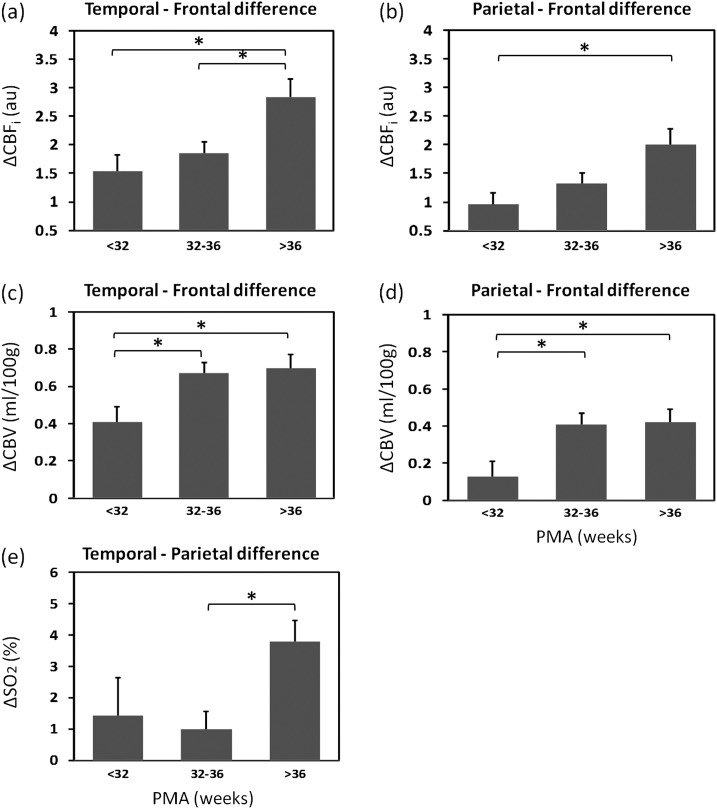
Figure 3.
Temporal–frontal difference and parietal–frontal difference in CBFi, (a and b) and CBV (c and d), and temporal–parietal difference in SO2 (e) for the 3 PMA groups. Mean differences and one standard error are reported and *indicates statistically significant differences between groups (P < 0.05 in post hoc test).

