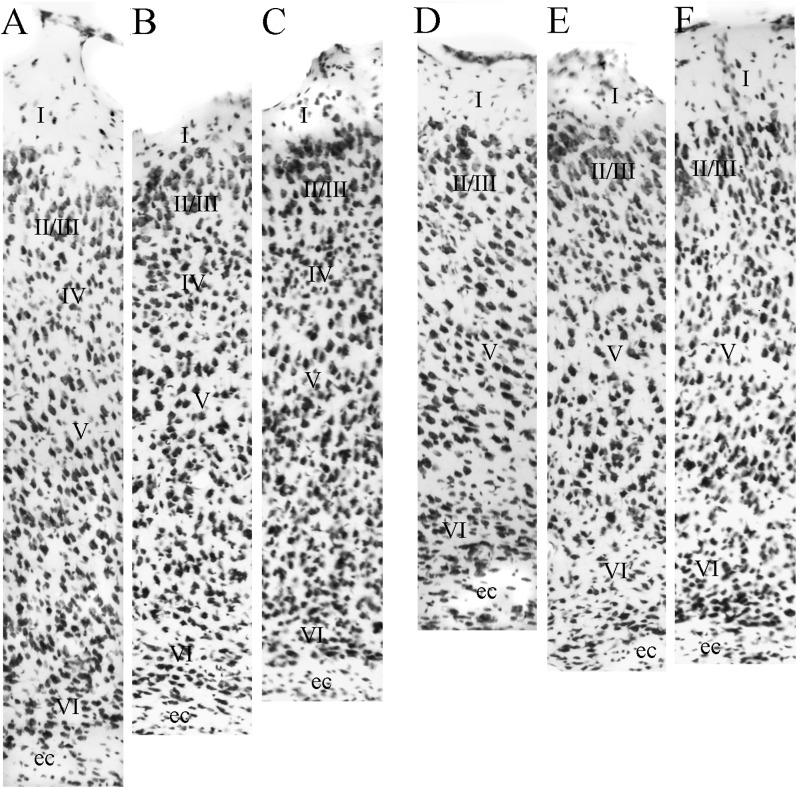
Figure 13.
Photomicrographs comparing cortical layers of PER areas area 36 and 35 across strains. Shown are cortical layers for area 36 (A–C) and area 35 (D–F) for the F1 (A and D), the C57BL6/J, (B and E), and 129P3/J (C and F) mouse strains. The tissue was stained for Nissl material. Scale bar = 100 μm.

