
Figure 2.
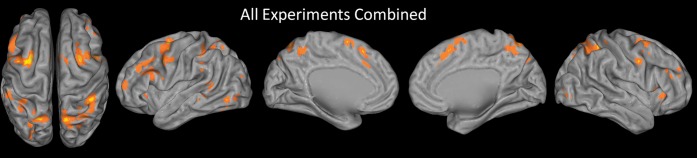
ALE map of all experiments combined. The sample included 36 experiments with 461 activation foci. Results are threshold at P < 0.05, corrected for multiple comparisons using false discovery rate and a 25 voxel extent criterion. Higher ALE values are depicted in yellow.