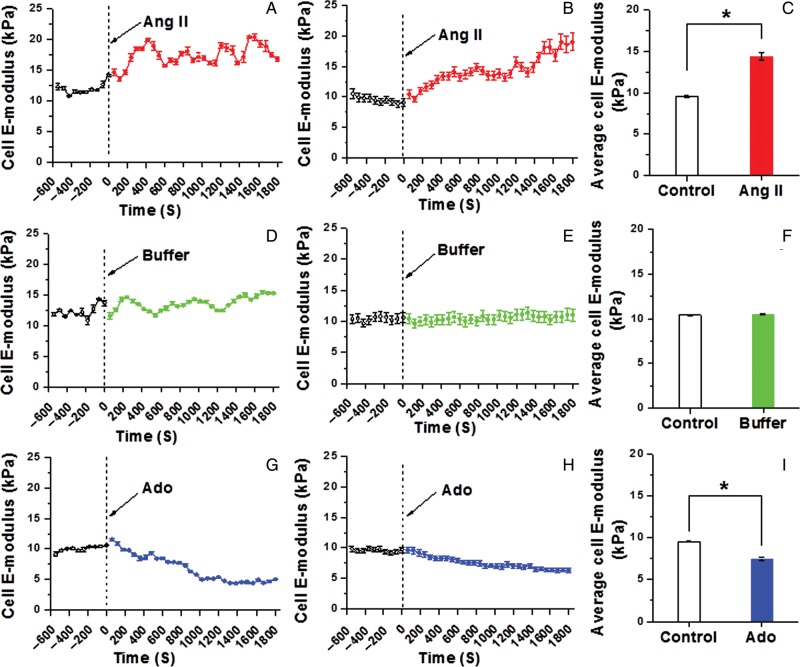
Figure 1.
Continuous real-time VSMC stiffness recordings following Ang II or Ado. (A) Representative single cell record of VSMC elastic modulus before and after addition of Ang II (10−6 M). (B) Group average of VSMC elastic modulus alteration before and after addition of Ang II (n = 10). (C) Average elastic modulus summed across all time points for the group of VSMCs before and after the addition of Ang II (n = 10, *P <0.05). (D) Representative single-cell measurement of elastic modulus before and after the addition of cell buffer only. (E) Group average of VSMC elastic modulus alteration after treatment with buffer vehicle only (n = 10). (F) Average elastic modulus summed for all time points of VSMC before and after treatment with buffer (n = 10). (G) Representative alteration in VSMC elastic modulus before and after the addition of Ado (10−4 M). (H) Group average of VSMC elastic modulus alteration before and after the addition of Ado (n = 8). (I) Average elastic modulus summed for all time points of VSMC before and after addition of Ado (n = 8, *P <0.05). Data were acquired at 0.1 Hz of indentation frequency and are presented as mean ± SEM.

