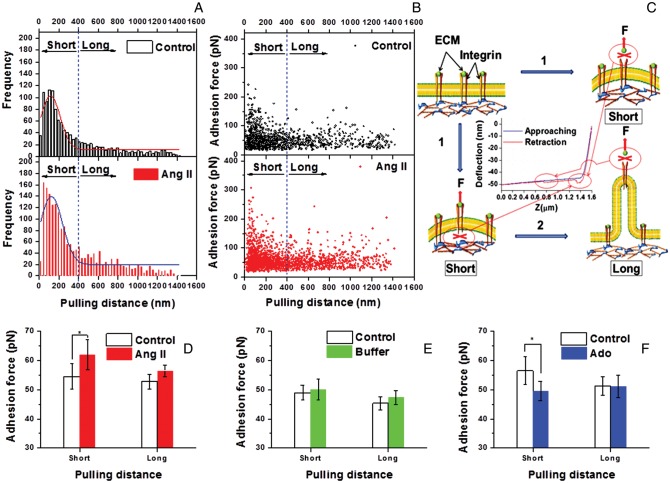
Figure 4.
Analyses of relationship between retraction distances and occurrence adhesion rupture. (A) Distribution of retraction distances at the time of adhesion rupture. (group/n = 10, only the last 600 s post-Ang II treatment data were included for comparison with the 600 s control recording to normalize for the recording time period). (B) The adhesion rupture force vs. retraction distance at the time of rupture (group/n = 10, only the last 600 s post-Ang II treatment data were included to normalize for the recording time period). (C) Illustration of possible adhesion models. (1) During short retraction from the cell the recorded rupture force is higher because of stronger attachment within the FN–integrin–cytoskeletal complex; (2) When the pulling force exerted on the cell exceeds the adhesion rupture force necessary to break connections within the FN–integrin–cytoskeletal complex the cell membrane is believed to deform into a lipid nanotube resulting in a second population of lower rupture force adhesion that break at and longer distances. The deflection signal (nm) of force curve was transformed to force signal (pN) by multiplying with the spring constant of the AFM cantilever. (D) Average adhesion rupture force between FN and VSMCs at long- (<400 nm) and short- (>400 nm) pulling distance before and after Ang II stimulation (n = 10, *P < 0.05). (E) Average adhesion rupture force between FN and VSMCs at long- and short-pulling distance before and after the addition of buffer in cell bath (n = 10). (F) Average adhesion rupture force between FN and VSMCs at long- and short-pulling distance before and after Ado stimulation (n = 8, *P <0.05). Data were acquired at 0.1 Hz of indentation frequency. Data for bar graphs are presented as mean ± SEM.

