
Figure 2.
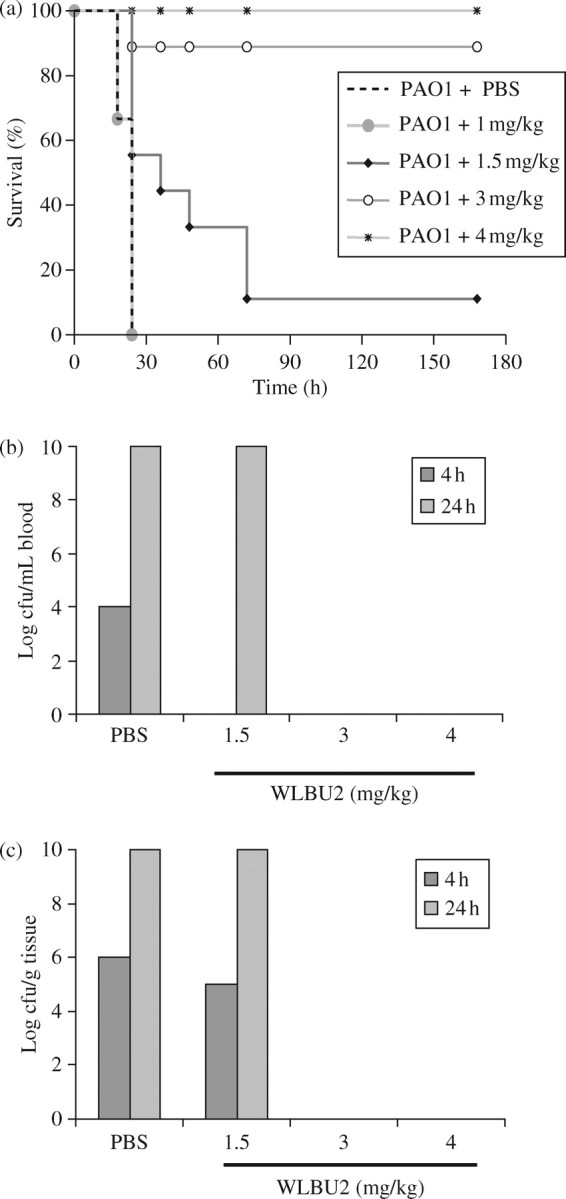
Survival and bacterial loads vary with peptide doses. (a) Kaplan–Meier survival analysis comparing varying doses of WLBU2 versus a PBS control group. (b) Log cfu/mL blood and (c) log cfu/g tissue at 4 and 24 h post-PA01 infusion.
Official websites use .gov
A
.gov website belongs to an official
government organization in the United States.
Secure .gov websites use HTTPS
A lock (
) or https:// means you've safely
connected to the .gov website. Share sensitive
information only on official, secure websites.
Survival and bacterial loads vary with peptide doses. (a) Kaplan–Meier survival analysis comparing varying doses of WLBU2 versus a PBS control group. (b) Log cfu/mL blood and (c) log cfu/g tissue at 4 and 24 h post-PA01 infusion.