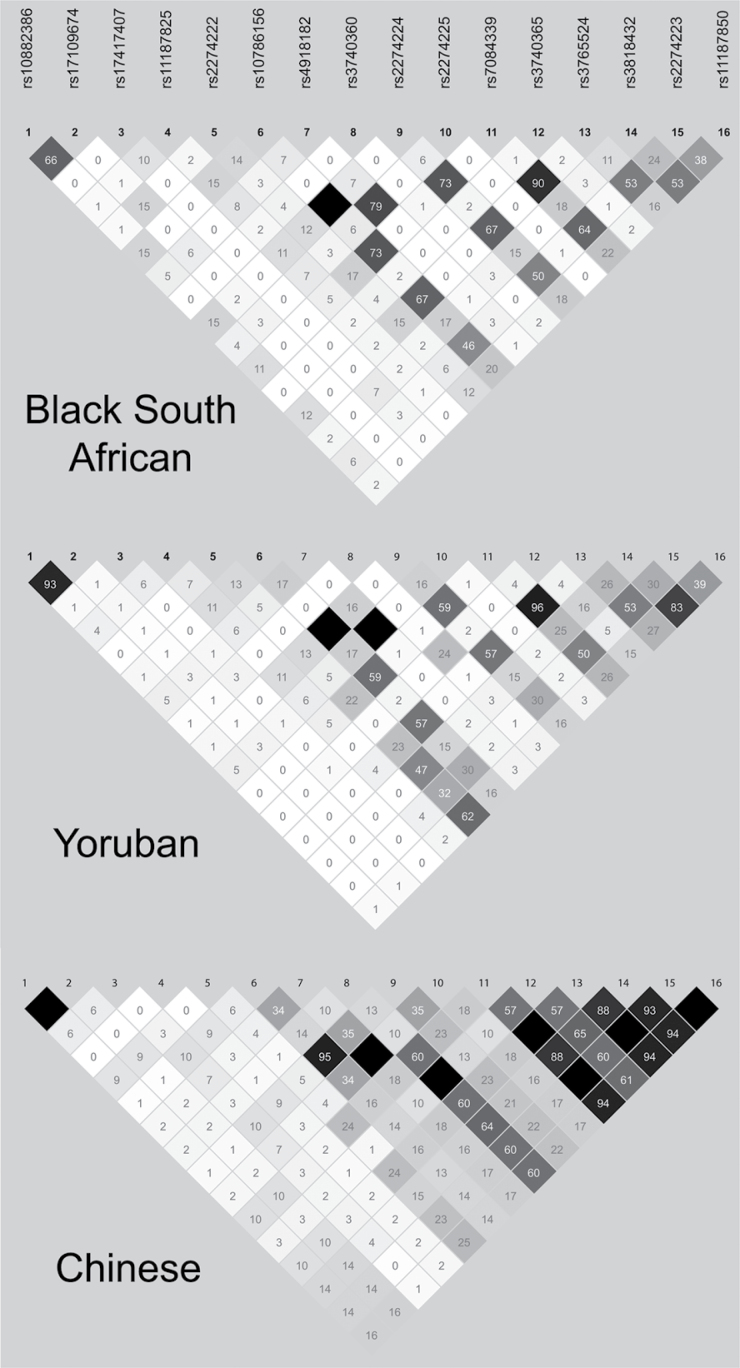
Fig. 2.
HapMap LD structure for 16 SNPs across PLCE1 gene region. Plots show r 2 values for pairwise LD between variants in the South African Black population and two HapMap populations, Yoruban from Nigeria and Han Chinese from Beijing. Colour schemes and labelling are according to Haploview as follows: white (r2 = 0), black (r2 = 1) or shades of grey (0 < r2 < 1); numbers indicate r2 values (×100).

