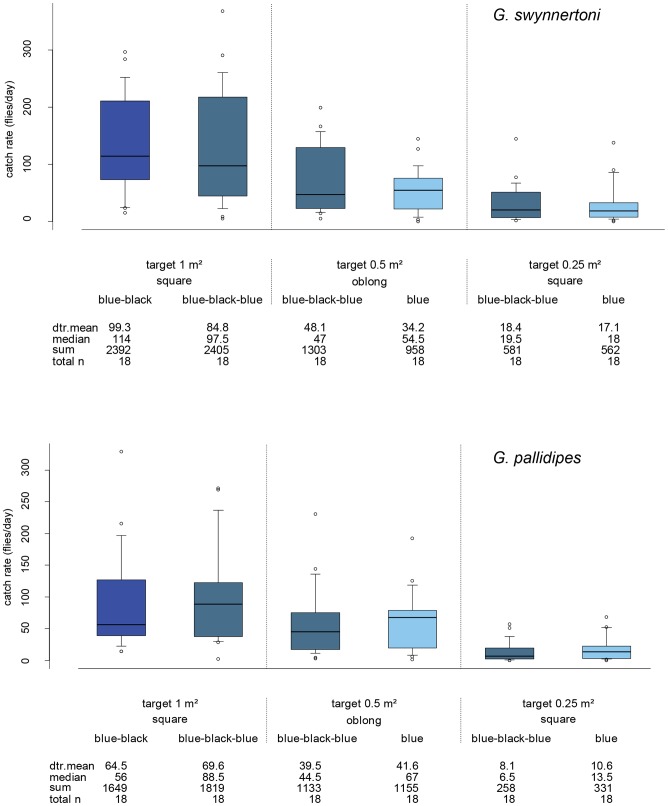
Figure 4. Daily catches of G. swynnertoni and G. pallidipes with different target types.
Targets were all blue, or of equal vertical rectangles of blue and black or blue-black-blue material. Devices were covered with adhesive film to compare the propensity of flies to land on the different target types. The limits of the boxes indicate the twenty-fifth and seventy-fifth percentiles; the solid line in the box is the median; the capped bars indicate the tenth and the ninetieth percentiles, and data points outside these limits are plotted as circles.

